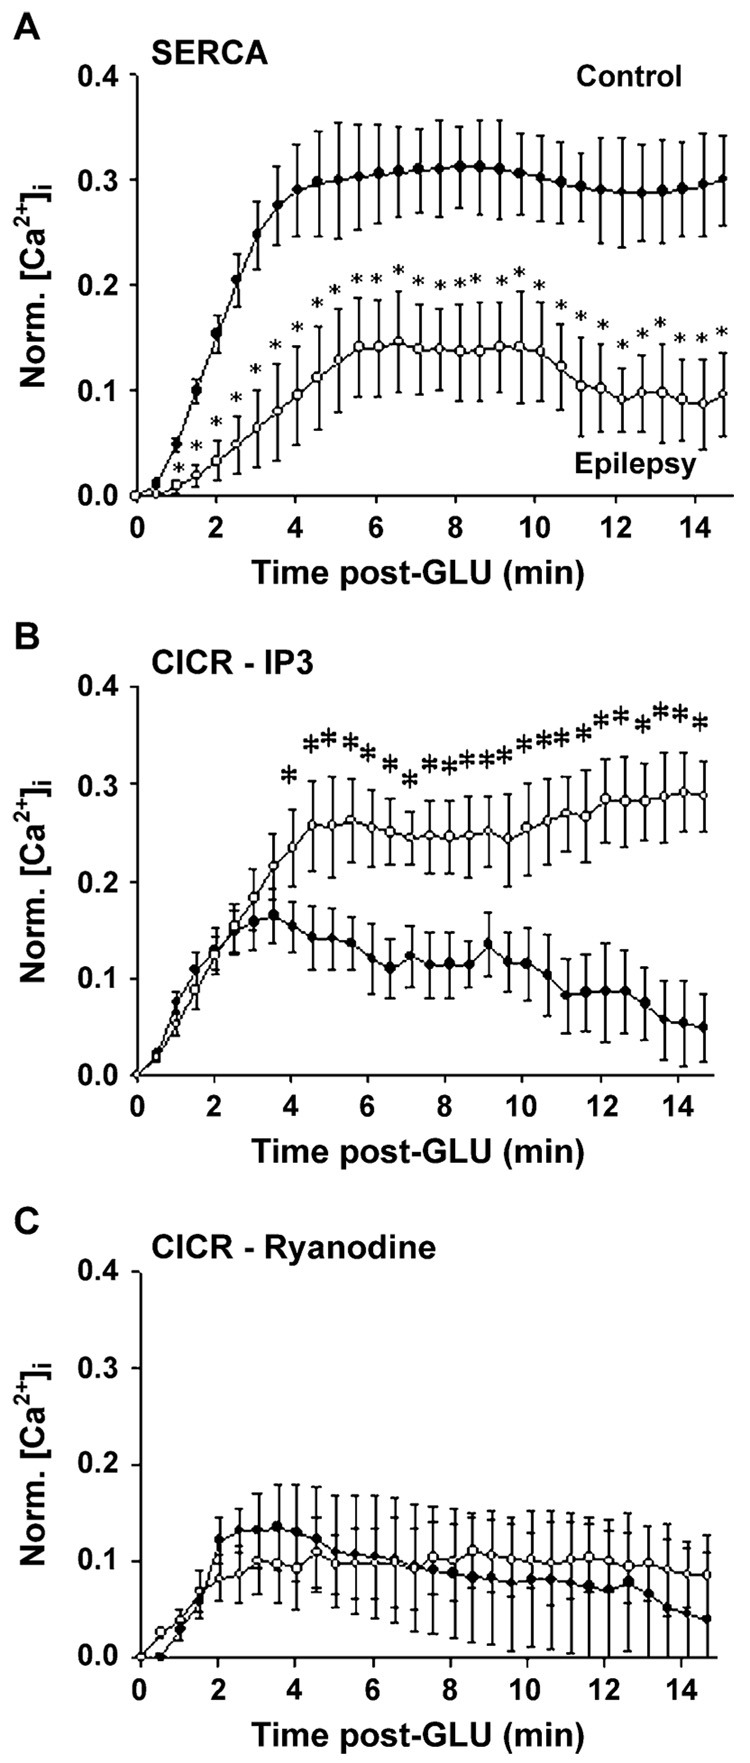
Fig. 12.
Activity of SERCA (A), CICR-IP3 (B), and CICR-Ryanodine (C) in control and epileptic neurons in the chronic epilepsy phase of AE in the SE-induced HNC model of AE. (Modified from Pal et al., 2001.) (A) SERCA activity in control and epileptic neurons. The results indicate epileptogenesis-inhibited SERCA activity. The data represent the means ± SE of the mean differences between the curves. These differences in means between the control and the “epileptic” curves were statistically significant (*p < 0.05, Hoteling’s T2-test). (B) Contribution of IP3 CICR activity to the delayed recovery of [Ca2+]i levels in normal and “epileptic” cells following a 50 µM glutamate [Ca2+]i load. IP3 CICR activity estimated for control and epileptic neurons. The curves indicate a much more augmented 2APB-inhibited release mechanism in the “epileptic” neurons compared to the control neurons. This release is an estimate of the IP3 receptor-activated CICR from the ER. The data represent the means ± SE of the mean differences between the curves. These differences in means between the control and the “epileptic” curves were statistically significant (*p < 0.05, Hoteling’s T2-test). (C) Contribution of ryanodine CICR activity to the delayed recovery of [Ca2+]i levels in normal and “epileptic” cells following a 50 µM glutamate [Ca2+]i load. Ryanodine CICR activity estimated for control and epileptic neurons. The curves indicate similar dantrolene-inhibited release in both control and “epileptic” neurons. This release represents the ryanodine receptor-activated CICR from the ER. The data represent the means ± SE of the mean differences between the curves. These differences in means between the control and the “epileptic” curves were not statistically significant (Hoteling’s T2-test).

