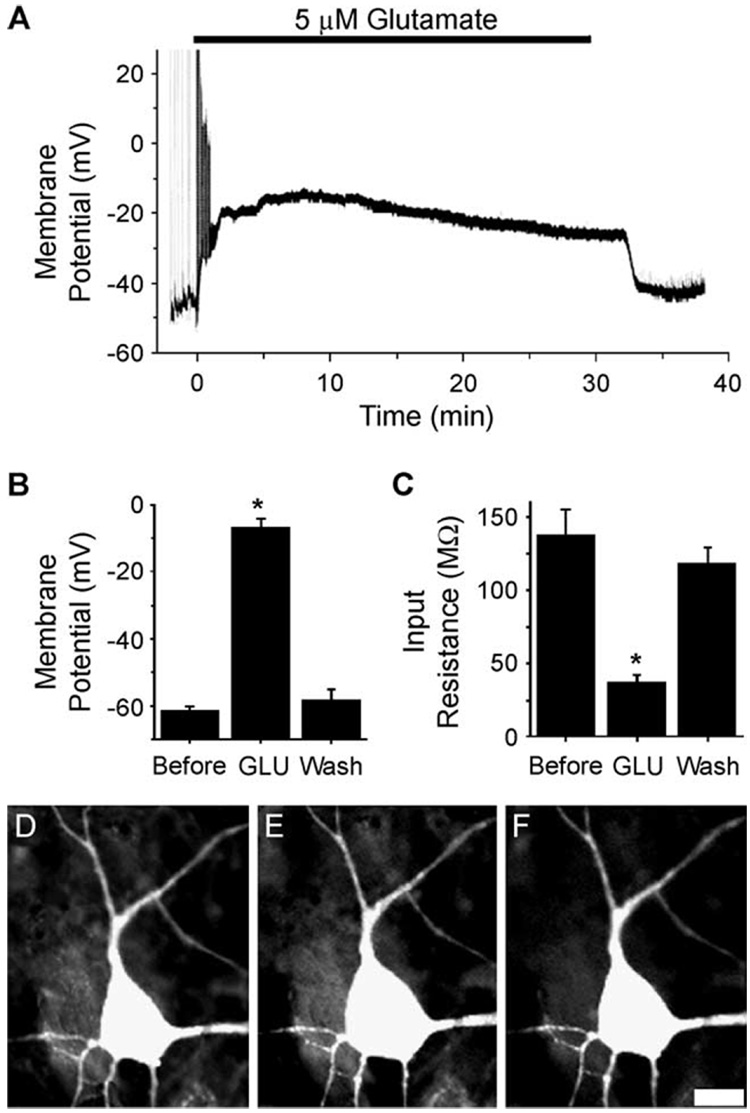
Fig. 4.
Effects of glutamate injury on hippocampal membrane potential (A and B), input resistance (C), and cell swelling (D–F). (A) Representative whole-cell current clamp recording of a hippocampal neuron before, during, and after glutamate application (5 µM, 30 min). In the presence of glutamate (black bar), this neuron depolarized from −52 to −17 mV, and synaptic potentials were lost. Upon washout, the neuron repolarized to −47 mV and EPSPs returned. (B) Effect of glutamate on neuronal membrane potential. Neuronal membrane potential before (Before, n = 12), during (GLU, n = 12), and 5 min or more after glutamate application (wash, n = 19). *p < 0.05 ANOVA, Tukey post hoc test. (C) Effect of glutamate on neuronal membrane input resistance. Neuronal membrane input resistance before (Before, n = 10), during (GLU, n = 10), and 5 min or more after glutamate application (wash, n = 10). *p < 0.05 RM ANOVA, Tukey post hoc test. Data are represented by mean ± SEM. (D–F) Glutamate-induced neuronal swelling. Digital images of a representative fluorescein-stained, hippocampal pyramidal shaped neuron before (D), during glutamate exposure (5 µM, 30 min; E), and within 1 hr of glutamate washout (F). In glutamate, this neuron swelled, increasing somatic area by 31%. The same neuron within an hour of washout restored preexposure morphology, only 4% greater than preexposure somatic area. Scale bar = 10 µM. (From Sun et al., 2001.)

