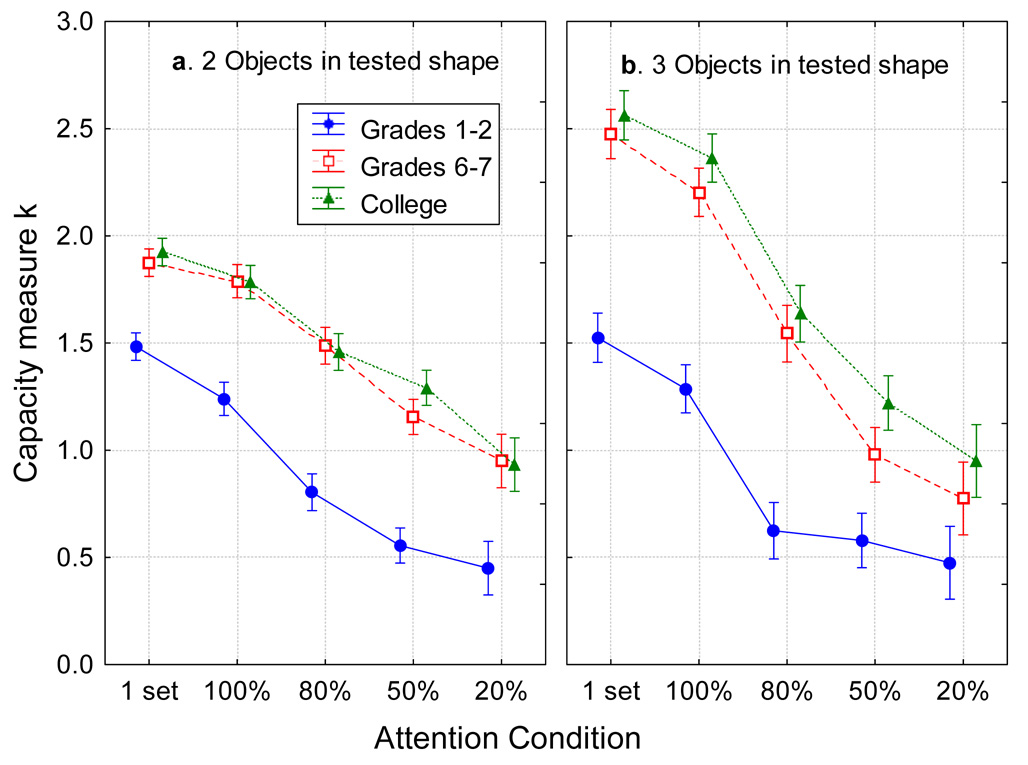
Figure 4.
The mean capacity measure k in each age group as a function of the attention condition. Within each panel, moving rightward, conditions reflect diminishing amounts of attention to be paid to the tested object. a. Arrays with 2 items in the tested shape. b. Arrays with 3 items in the tested shape. This capacity measure is based on combining responses to indicate if the probe matched the array item presented in that location, or differed from it. Error bars are standard errors.

