
Figure 1.
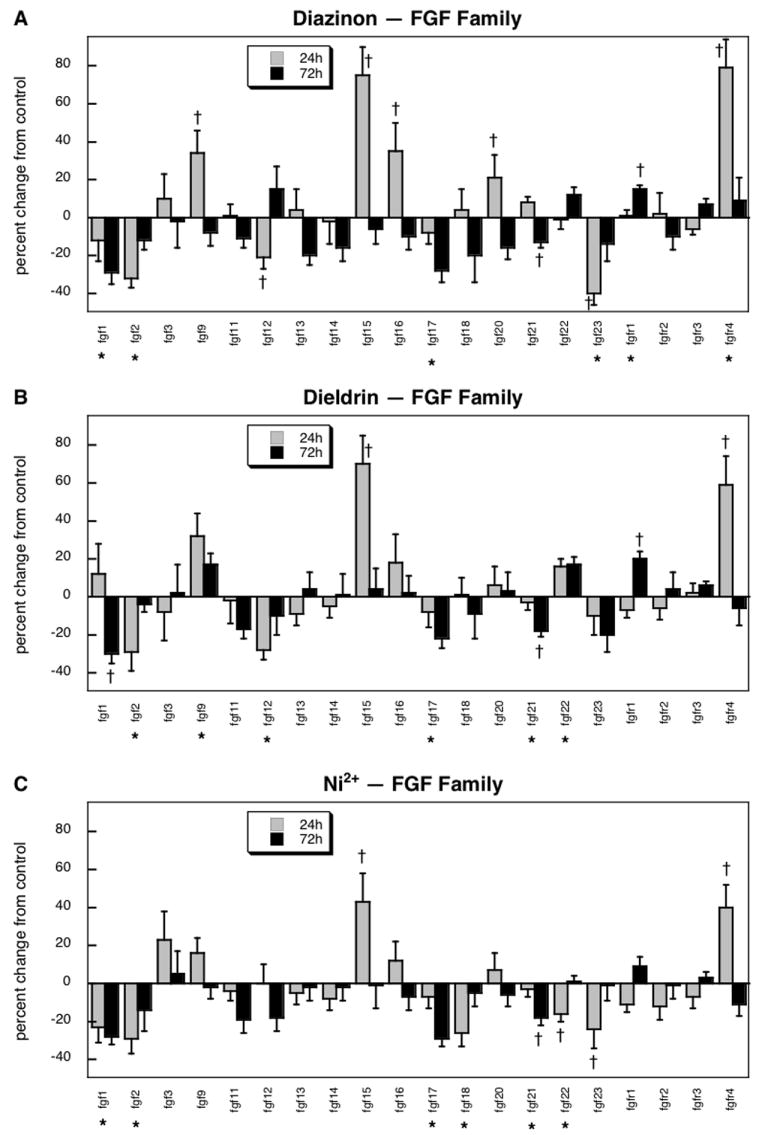
Effects of 30 μM diazinon (A), dieldrin (B) or Ni2+ (C) exposure on expression of genes comprising the fgf family and related receptors. Asterisks shown below each gene denote a significant main treatment effect. Daggers denote genes for which a treatment × time interaction was detected and show the individual times for which treatment effects were present. Multivariate ANOVA (all treatments, time) indicates a significant main effect of treatment (p < 0.04) and interactions of treatment × time (p < 0.01), treatment × gene (p < 0.004) and treatment × gene × time (p < 0.04).