
Fig. 3.
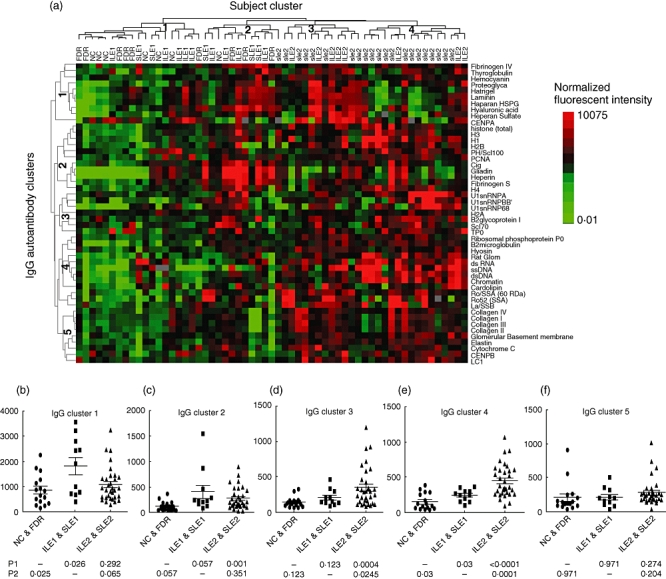
(a) Hierarchical cluster analysis of 49 immuoglobulin (Ig)G autoantibody profiles in 59 samples [seven non-autoimmune control (NC), nine first-degree relatives (FDR), nine incomplete lupus erythematosus (ILE1), five systemic lupus erythematosus (SLE1), eight ILE2 and 21 SLE2] measured on the autoantigen array. The normalized signal intensity of each antibody was analysed using Cluster/Treeview software. Each row represents one autoantibody specificity and each column represents an individual subject. The expression of each antibody in all subjects was mean-centred. Red represents expression values higher than the row mean, green represents expression values lower than the row mean, black represents values close to the row mean and grey represents missing data. All measured samples were clustered into four subject groups (19 samples in cluster 1, 12 in cluster 2, 12 in cluster 3 and 16 in cluster 4, as shown at the top of the heat map) and all autoantibodies were clustered into five IgG autoantibody clusters, with 10 autoantibodies in cluster 1, 11 in cluster 2, seven in cluster 3, 12 in cluster 4 and nine in cluster 5, shown to the left of the heat map. Cluster 1 contains 10 autoantibodies including fibrinogen IV, thyroglobulin, haemocyanin, proteoglycan, matrigel, laminin, heparan sulphate proteoglycan (HSPG), hyaluronic acid, heparan sulphate and centromere protein A (CENP-A); cluster 2 contains 11 autoantibodies including total histone, histones H1, H2B, H3, H4, PM/Scl100, proliferating cell nuclear antigen (PCNA), C1q, gliadin, heparin and fibrinogen S; cluster 3 contains seven autoantibodies including U1snRNP-A, U1snRNP-BB’, U1snRNP-68, H2A, β2 glycoprotein I, Scl70 and TPO, cluster 4 contains 12 autoantibodies including dsDNA, ssDNA, dsRNA, chromatin, glomerular extract, Sjögren's syndrome antigen A (Ro/SSA), La/SSB, ribosomal phosphoprotein P0, myosin, β2 microglobulin and cardolipin, and cluster 5 contains nine autoantibodies including collagen I, collagen II, collagen III, collagen IV, elastin, cytochrome C, glomerular basement membrane, CENP-B and LC1 (b–f). The average expression value of the IgG autoantibodies in each of the five clusters was calculated for each sample and the difference between the three sample groups [non-autoimmune control (NC) and first-degree relatives (FDR), ILE1 and SLE1, ILE2 and SLE2, representing control, interferon (IFN)-low and IFN-high, respectively] was compared using a non-parametric t-test (Mann–Whitney). P1 represents P-value compared with the control group and P2 represents P-value compared with the IFN-low group. Pearson correlation analysis showed that clusters 3 and 4 were correlated positively with IGI value in ILE and SLE samples (R = 0·43, P = 0·0006 in cluster 3; R = 0·49, P < 0·0001 in cluster 4) (data not shown).