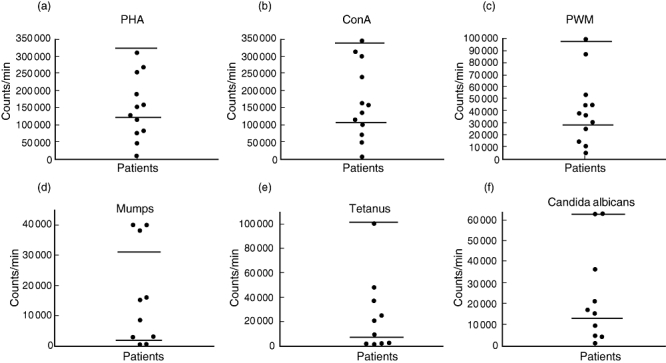
Fig. 2.

Each point represents counts for an individual patient. Horizontal lines indicate upper and lower limits of normal for each mitogen or antigen tested. (a) Response to mitogen phytohaemagglutinin (PHA); (b) response to mitogen concavalin A (ConA); (c) response to pokeweed mitogen (PWM); (d) response to antigen mumps virus; (e) response to antigen Candida albicans; (f) response to antigen tetanus toxoid.
