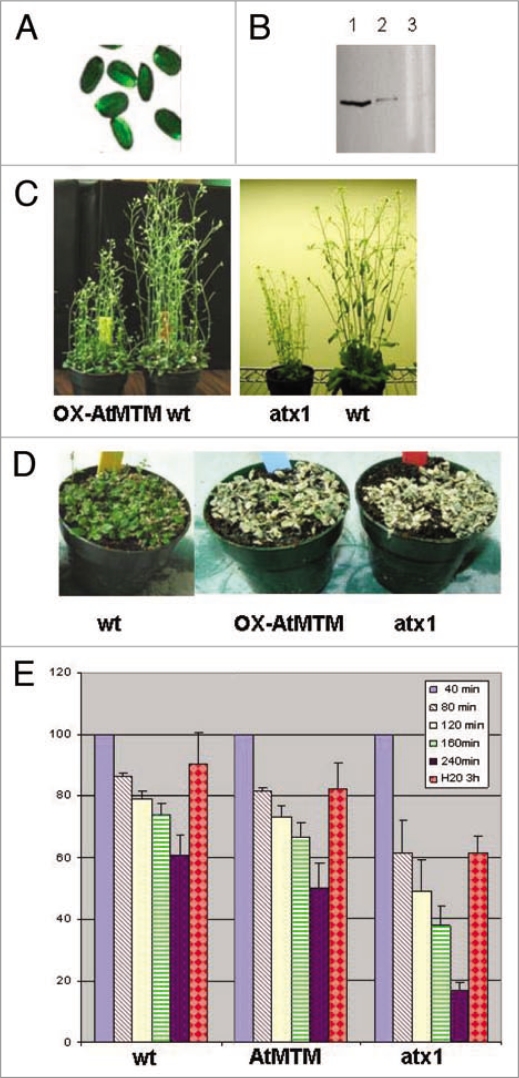
Figure 4.
OX-AtMTM lines and responses of OX-AtMTM and of atx1 mutant plants to drought. (A) Transcript levels of GFP on seed coats, reflecting the overexpression of AtMTM1. Overexpressing plants can be easily identified under fluorescent microscope; (B) western blots of two stably HA-AtMTM1 overexpressing lines showing different levels of ectopic AtMTM1 accumulation (lanes 1 and 2) as detected with HA antibody. Lane 3 is extract from wild type plants as a negative control; (C) Stably transformed AtMTM1-overexpressing and wild type plants grown under regular irrigation (left-hand). atx1 and wild type plants grown under exactly the same conditions (right-hand); (D) wild type, OX-AtMTM, and atx1 plants not watered for five days followed by two days of irrigation; (E) Water loss in detached leaves as a function of time exposed to air. Changes in tissue mass upon air exposure for the indicated periods of time, followed by submersion in water for three hours are shown as percentage of the weight of starting tissue material taken as 100% for each sample. Bars are averages of three independent measurements. Changes were statistically significant, t-test p > 0.01 for all samples.

