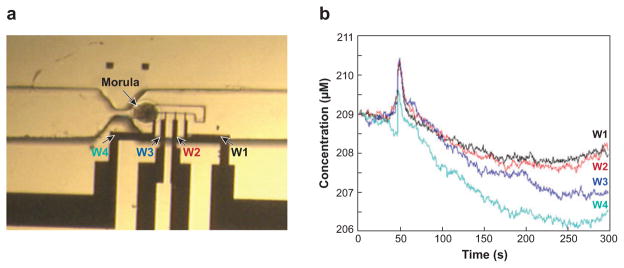
Figure 6.
(a) An optical image and (b) amperometric recordings of oxygen consumption obtained from a bovine embryo adhered to a microfluidic device integrated with four working electrodes (labeled W1, W2, W3, and W4 in the optical image). Panel a shows the immobilized embryo at the gate position; the plot of the oxygen concentration profile consumed by the day-6 embryo at the morula stage was obtained with the amperometric detector array at room temperature against time. The monitored concentration profiles for each electrode are shown in panel b. Reproduced from Reference 106 with permission.

