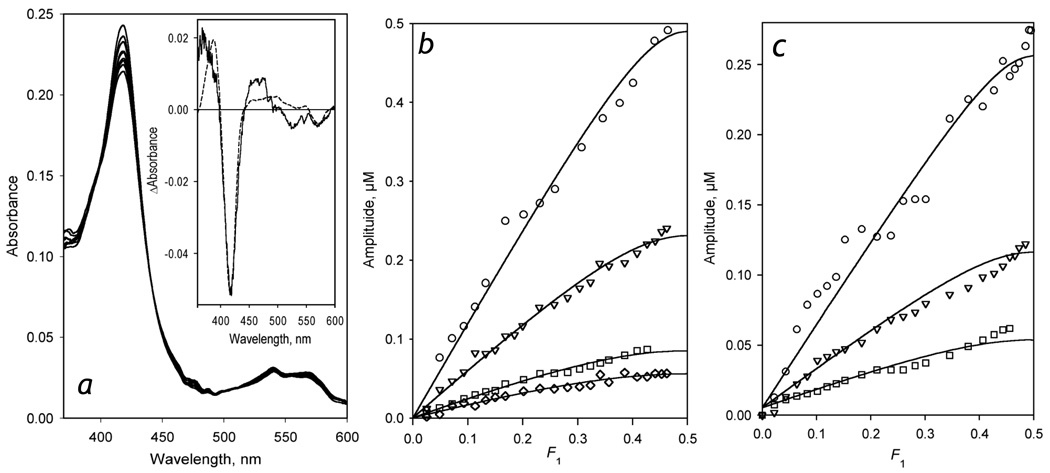
Figure 1.
Formation of the CYP3A4 complexes with BMR studied by counter-flow (tandem cell) continuous variation titration. The interactions were monitored by the changes in the concentration of P450 low spin and high spin states. Panel a shows a series of spectra obtained in the experiment with CYP3A4 containing liposomes (LPS-76) at a concentration of 5 µM. The inset represents the spectrum of the first principal component obtained by PCA. The dashed line shows the approximation of this spectrum by the set of CYP3A4 absorbance standards. Panel b shows a series of titration curves obtained with LPS-76 and BMR taken at the concentration of 5 (circles), 2.6 (triangles), 1.1 (squares) and 0.8 µM (diamomds). Panel c represents a series obtained with CYP3A4-ND and BMR at a concentration of 5.3 (circles), 2.6 (triangles), and 1.3 µM (squares). Solid lines represent the results of the fitting of the data sets to the equation for the equilibrium of bimolecular association suited to the case of the counter-flow titration (eq. (3) in [50]).

