Figure 2.
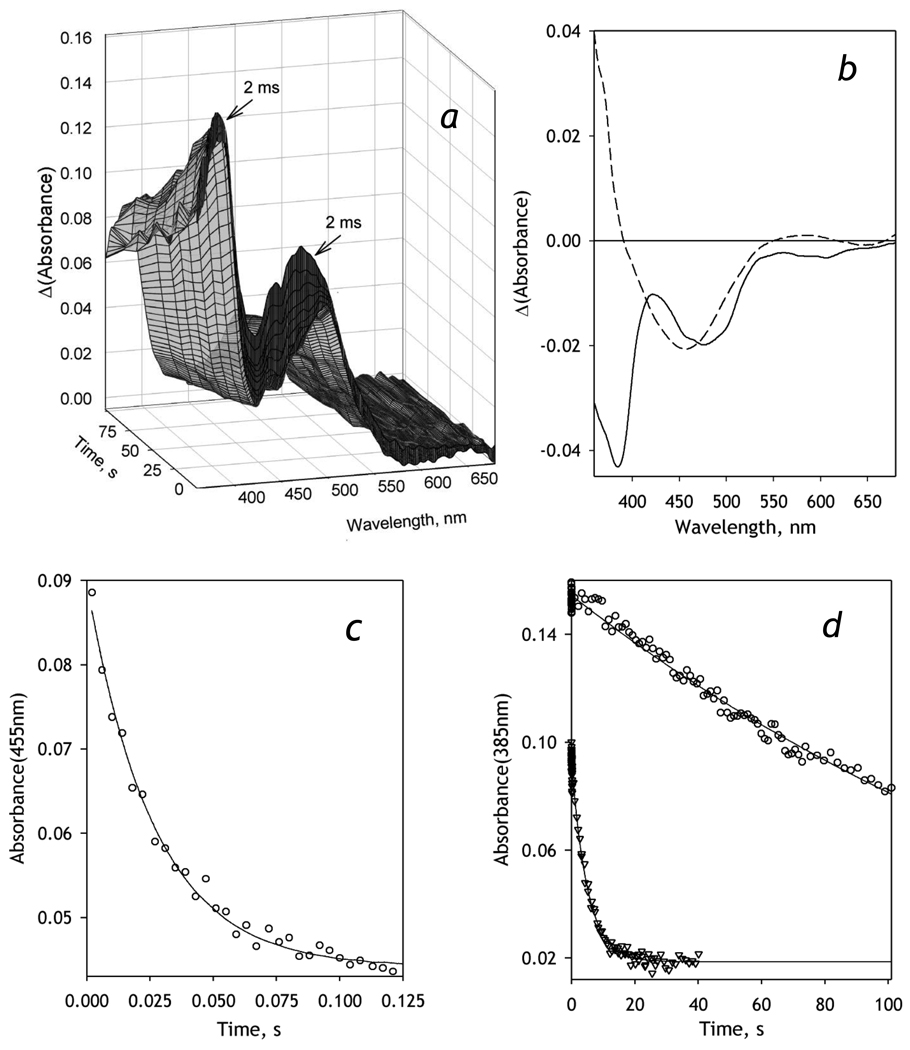
Kinetics of NADPH-dependent reduction of BMR recorded with a rapid scanning stop-flow technique. Conditions: 20 µM BMR, 0.2 mM NADPH in 0.1 M Na-Hepes buffer, pH 7.4, 1 mM DTT, 1 mM EDTA containing NADPH-generating and oxygen-scavenging systems (see Materials and Methods), 5 °C. Spectra recorded in a stop-flow cell with 5 mm optical path length. a: Absorbance spectra of BMR taken during the reduction. The first spectrum corresponds to ~2 ms after addition of NADPH. b: The spectra of the first (solid line) and the second (dashed line) principal components found by PCA applied to a manifold of 5 series of spectra obtained in independent experiments. Panels c and d show the changes in absorbance at 455 and 385 nm respectively. Data points in circles correspond to the data set obtained at 5 °C shown in panel a. The data points shown in triangles in panel d represent a similar experiment at 25 °C. Solid lines show the results of fitting of the kinetic curves by a first order kinetic equation.

