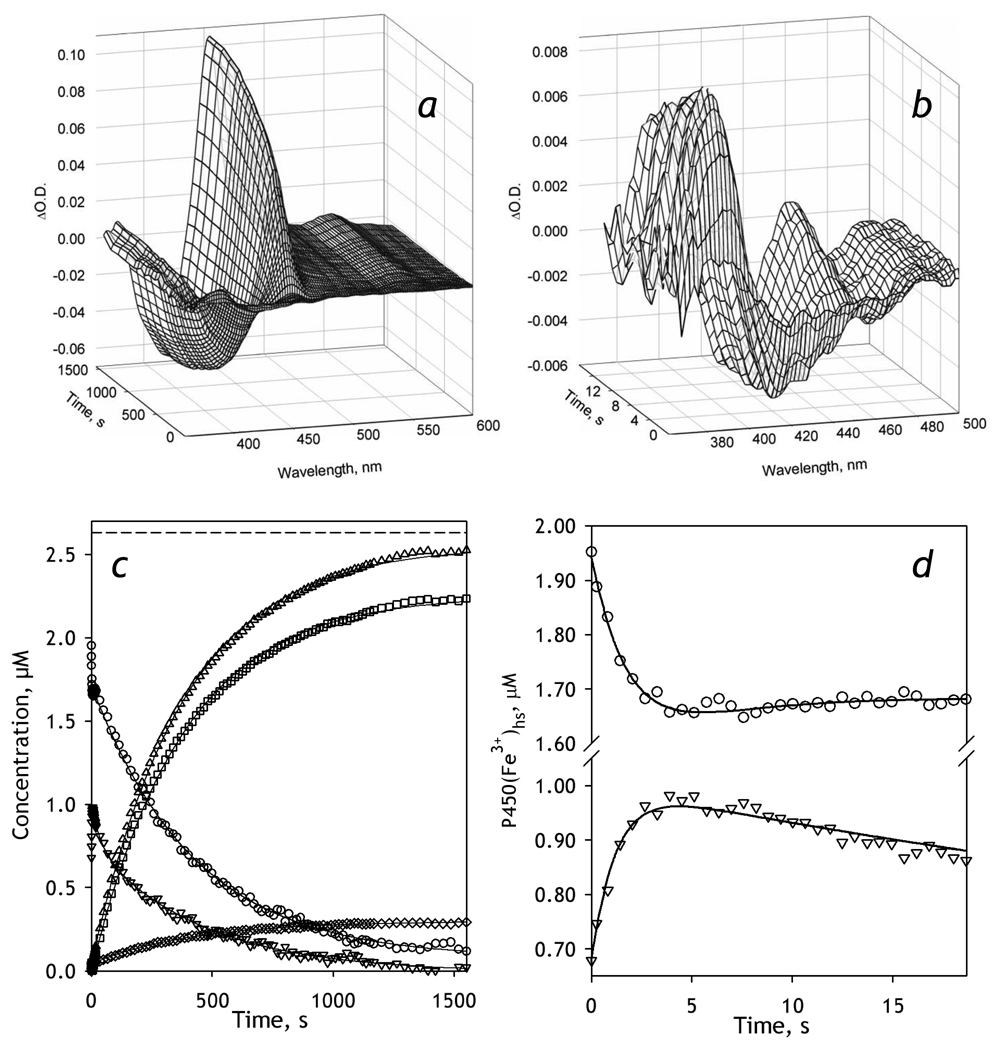
Figure 3.
Kinetics of BMR-dependent reduction of CYP3A4-ND in the absence of substrate. Conditions: 2.6 µM 3A4, 5.2 µM BMR, 0.2 mM NADPH, CO-saturated 0.1 M Na-Hepes buffer, pH 7.4, 1 mM DTT, 1 mM EDTA containing oxygen-scavenging and NADPH-generating systems (see Materials and Methods), 25 °C. Spectra recorded in a stop-flow cell with 5 mm optical path length. a, b: Changes in absorbance in the Soret region during the reduction. The spectrum measured at time of origin is subtracted. Panel b scales up the spectra representing the first 14 seconds after mixing. c: The time course of the changes in the concentrations of the carbonyl complexes of CYP3A4(Fe2+) P450 (squares) and P420 states (diamonds), their total (triangles), as well as the low-spin (circles) and the high-spin (inverted triangles) states of CYP3A4(Fe3+). The dashed line indicates the total concentration of CYP3A4. Panel d shows the initial part of the kinetic curves for the low-spin (circles) and the high-spin (inverted triangles) states of CYP3A4(Fe3+).

