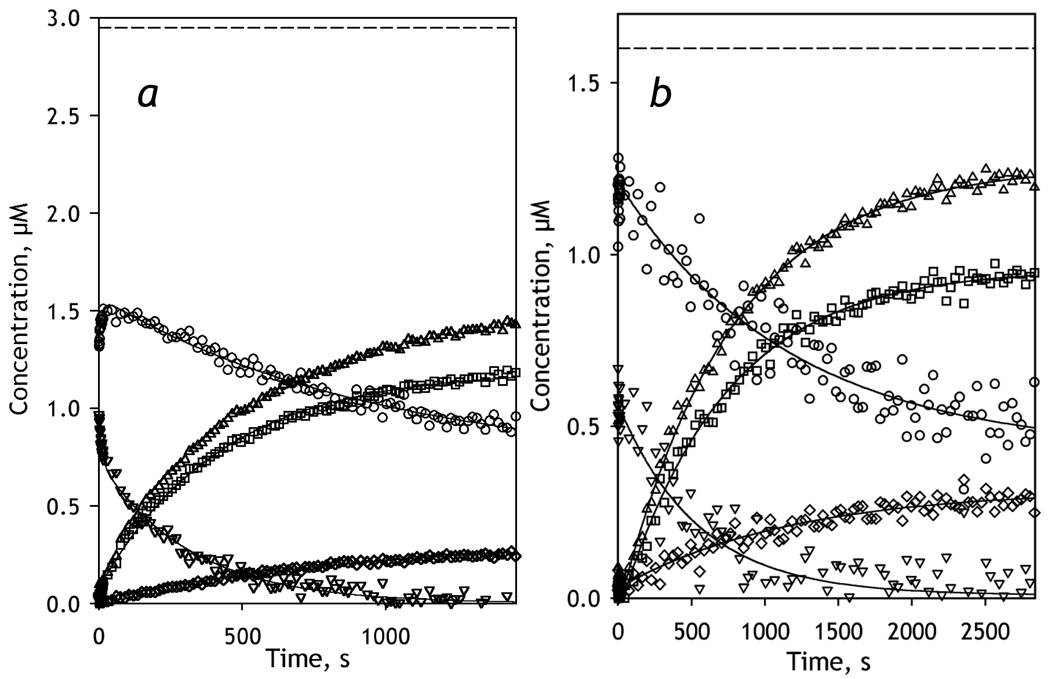
Figure 4.
Kinetics of BMR-dependent reduction of CYP3A4 incorporated in proteoliposomes at a 1:76 (LPS-76, a) or 1:910 (LPS-910, b) molar ratio of CYP3A4 to phospholipids. Reaction mixtures contained 2.95 (a) and 1.6 µM µM (b) CYP3A4 in proteoliposomes and a two-fold molar excess of BMR. Other conditions were as indicated for Fig. 3. The panels show the time course of the changes in the concentrations of the carbonyl complexes of CYP3A4(Fe2+) P450 (squares) and P420 states (diamonds), their total (triangles), as well as the low-spin (circles) and the high-spin (inverted triangles) states of CYP3A4(Fe3+). The dashed line indicates the total concentration of CYP3A4.

