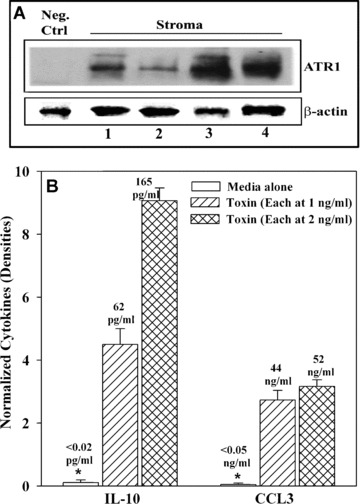
Figure 5.

Effects of anthrax toxins on IL‐10 and CCL3 production in BM stroma. (A) Membrane extracts from four different donors were analysed for ATR1 by combination of immunoprecipitation and Western blots. Negative control used cytoplasmic extracts from CD34+/CD38+. In parallel studies, Western blots were done for β‐actin. (B) Stromal cells were stimulated with 1 or 2 ng/ml of anthrax toxins and after 16 hrs, the culture media and cell extracts were analysed by cytokine microarrays. The densities of internal positive controls were assigned values of 10 and then used as reference for unknown densities. The results represent three experiments, mean ± S.D. The array studies are presented as bar graphs and the ELISA results are placed immediately above each graph.
