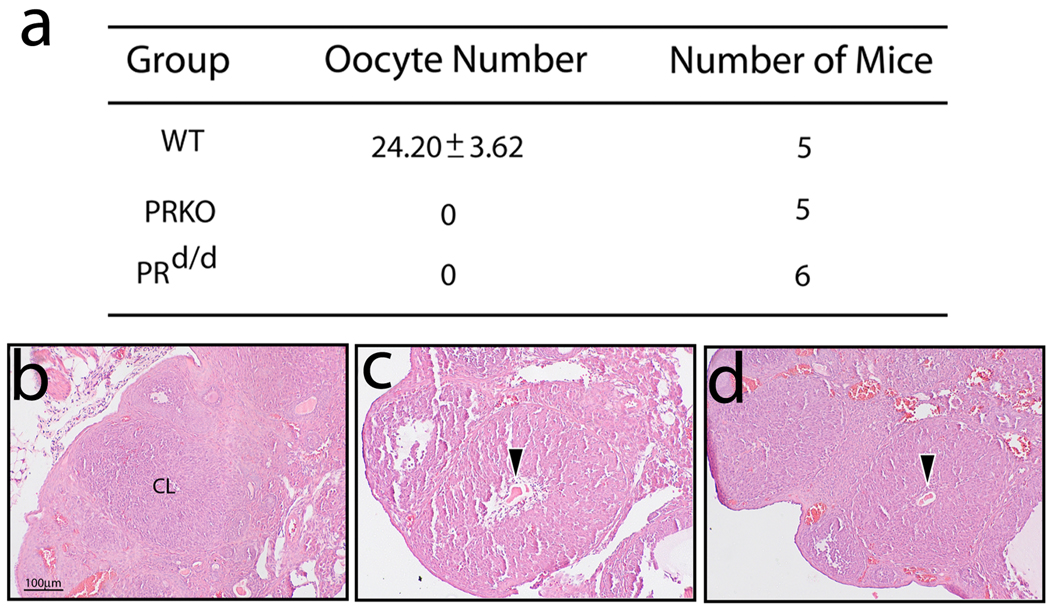
FIG. 3.
Ovulation impairment in the gonadotropin treated PRd/d mouse. (a) Table summarizes the average number of oocytes (± SEM) retrieved per mouse following gonadotropin treatment (see Materials & Methods). Note that the WT ovary yields a significant number of oocytes whereas oocytes are absent from the similarly treated PRKO and PRd/d ovary. (b) Representative section (stained with H&E) of a WT ovary following gonadotropin treatment. Note the absence of intraovarian oocytes but the presence of a corpus luteum (CL). (c) and (d) show representative sections of an ovary derived from similarly treated PRKO and PRd/d mice respectively. Arrowhead indicates the position of an entrapped oocyte within CLs in both sections. Scale bar in (b) applies to (c) and (d) (N=5 per genotype).

