
Figure 3. Genetic deletion of Gpbar1 alters frequency with which pathological calcium transients are observed after exposure of cells to TLCS but not after exposure of cells to a supramaximally stimulating concentration of caerulein.
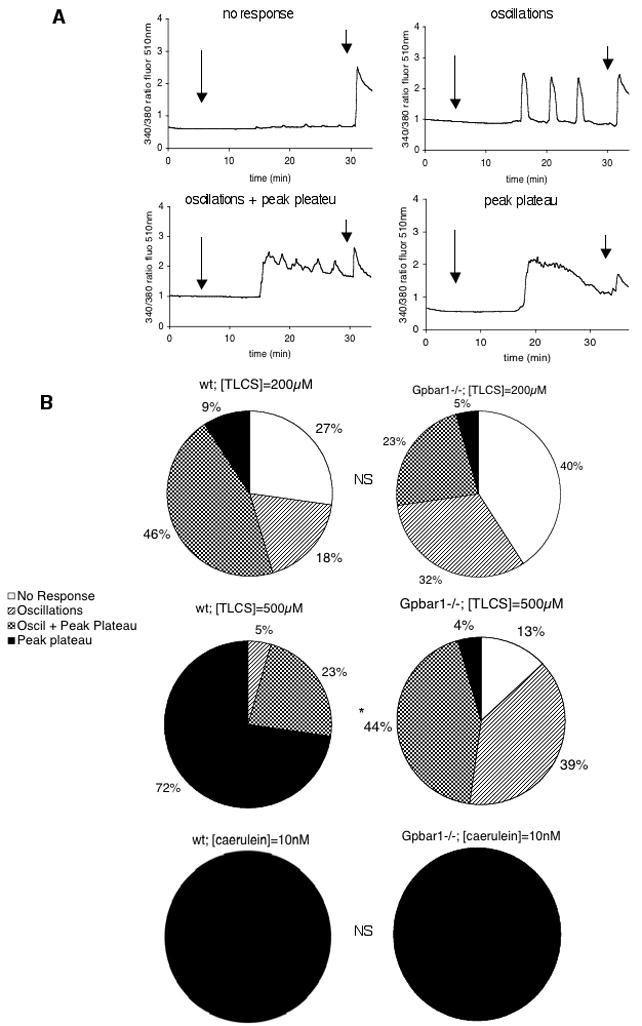
Small pancreatic acini from wild type and Gpbar1−/− mice were exposed to 200 μM and 500 μM TLCS or to 10 nM caerulein and calcium transients were monitored in individual acinar cells as described in the text. Panel A shows tracings that are representative of the 4 patterns as described in the text. Long arrows denote time of TLCS addition while short arrows denote time of caerulein addition. This latter addition was used to confirm maintenance of cell viability and functionality throughout the experiment. Panel B reports frequency with which each response pattern was observed after exposure of wild type or Gpbar1 −/− acini to either TLCS or caerulein. Asterisks denote significant differences (p<0.01) when Gpbar1−/− acini are compared to wild type acini. NS = not significant.