
Figure 5. T cell secretion of TNF-α, IFN-γ, and IL-2 is inhibited by MK001.

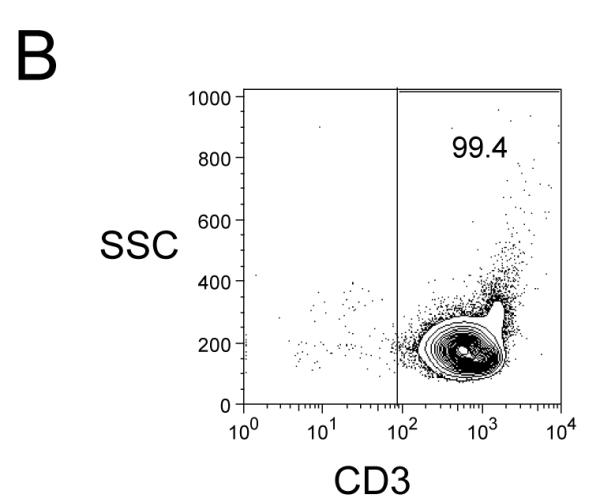

(A) PBMC from an HCV-infected subject were enriched for T cells and cultured with 0.5% DMSO or media (not shown) or plate-bound anti-CD3 (10 μg/mL) in the presence of MK001 (20 μg/mL) or vehicle (DMSO) for 24 hours. TNF-α, IFN-γ, and IL-2 levels in culture supernatants were evaluated using multiplex ELISA. Detection limits were 2 pg/mL, 2 pg/mL, and 4 pg/mL, respectively. (B) Purity of enriched CD3+ T cells used in (A) was assessed using flow cytometric analysis, gating on CD45+ live lymphocytes (NB: purity was 97.5% without gating). (C) PBMC from a second HCV-infected subject were stimulated with negative controls (DMSO or media) or plate-bound anti-CD3 (10 μg/mL), or PHA (1.6 μg/mL) in the presence of MK001 (20 μg/mL) or vehicle (DMSO) for 16 hours. Intracellular TNF-α and IFN-γ cytokine expression were evaluated in the presence of 1 μg/mL brefeldin A. Violet viability dye was used to distinguish live cells (from dead), and cells were further selected on the basis of CD5 expression and the absence of CD56 expression. TNF-α expression (x-axis, left panels) and IFN-γ (x-axis, right panels) from live CD5+CD8+CD56- lymphocytes are shown in the upper right quadrant. Percentages of cells in each quadrant are displayed. Cytokines detected in the CD5+CD8-CD56- population were confirmed to derive from CD5+CD4+CD56- cells in the same experiment, and CD5+CD8+ T cells previously confirmed to represent the same population as CD3+CD8+ T cells (data not shown).