
Fig 3.
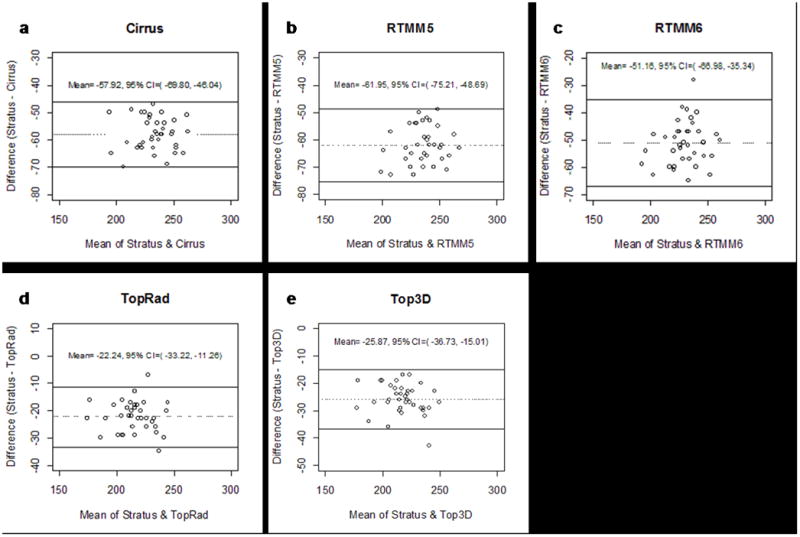
Bland-Altman plots of central subfield thickness, displayed as the difference between Cirrus HD-OCT (a); RTVue-100 MM5 (b); RTVue-100 MM6 (c); 3D OCT-1000 Radial (d); 3D OCT-1000 3D Macular (e) and Stratus OCT versus the average of the 2 measurements. Lines indicating average mean difference with 95% confidence limits are shown.