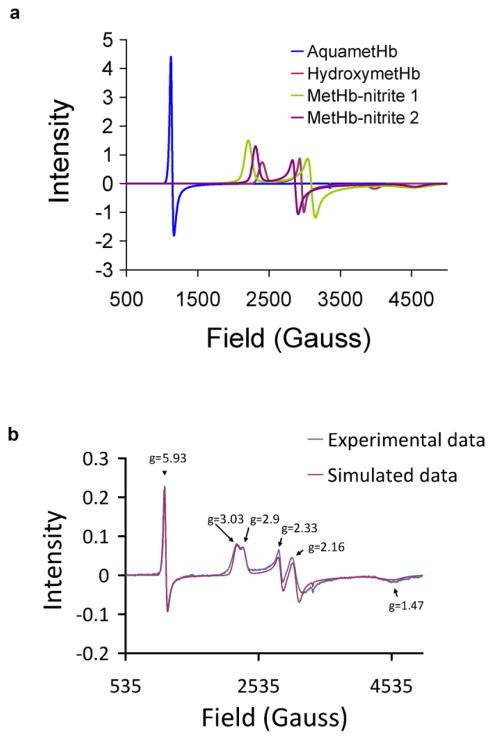
Figure 2. Simulation of MetHb-nitrite EPR.
(a) The four basis spectra for simulations are shown (b)Experimental EPR spectrum (blue) was taken at 15K and 0.8mW microwave power. MetHb-nitrite was prepared in 0.01M PBS buffer at pH 7.4 by adding 10mM nitrite to 200uM MetHb. Three separate species were simulated with SimFonia and added together to produce the simulated spectrum. These species include a high spin MetHb species with principal g values of 5.93, 5.93, 1.99 and two low spin MetHb-Nitrite species with principal g values of 3.03, 2.33, 1.47 and 2.90, 2.16, and 1.47. (g values are close to that determined by Schwab et. al. [29]). The double integrals of the three simulated spectra were used to calculate the concentration of the corresponding species which were subsequently used to calculate the Kd values for MetHb-nitrite under the conditions used.

