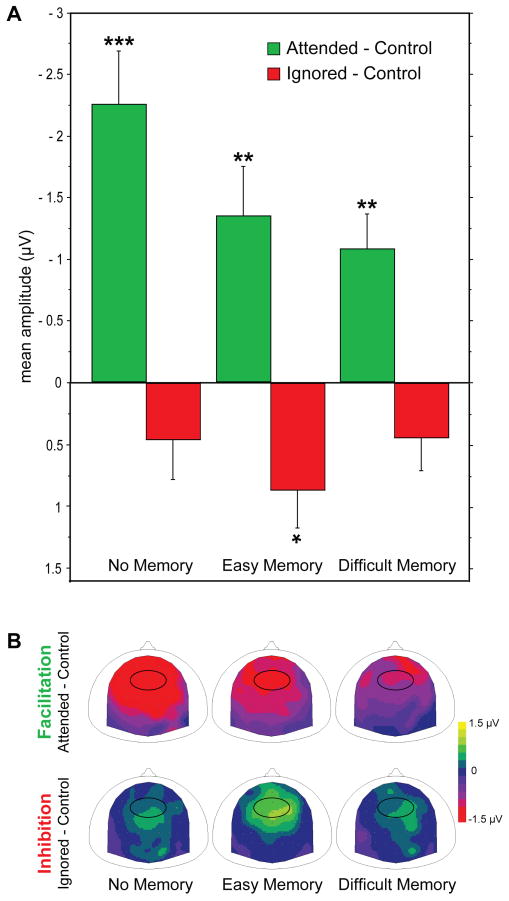
Figure 2. Effect of the memory task difficulty on attention effects.
(A) Mean ERP amplitudes (fronto-central group, 200-250 ms) of attention-mediated facilitation (green) and inhibition (red) effects as a function of the memory task difficulty (no, easy, difficult). Facilitation and inhibition effects are represented as the mean difference between ERPs to attended and control, and to ignored and control standards, respectively. Error bars represent 1 s.e.m. Stars indicate significant differences assessed by permutation post-hoc tests of the interaction (attention by memory) effect (*: P < 0.05; **: P < 0.01; ***: P < 0.001). (B) Scalp topographies (top view) of the attention effects (200-250 ms): facilitation (mean difference between ERPs to attended and control standards) and inhibition (mean difference between ERPs to ignored and control standards). The black oval surrounds the fronto-central electrode group used for computation of mean amplitudes and statistical analysis represented in A.

