
Figure 5.
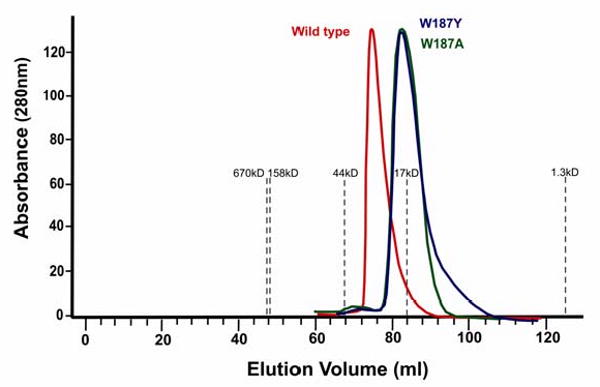
HPLC profiles of wild type and mutant NS1A-ED. The wild type elution profile is shown as a red line, the W187A mutant is shown in green, and the W187Y mutant is shown in blue. Absorbance was measured at 280 nm, and the gray dashed lines indicate the position of protein standards. From left to right, they are: thyroglobulin (670kD), bovine gamma globulin (158kD), chicken ovalbumin (44 kD), equine myoglobin (17kD) and Vitamin B12 (1.35kD).