
Figure 6.
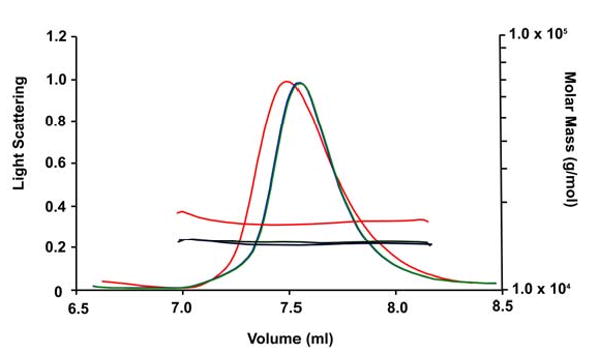
Light scattering measurement of wild type and mutant NS1A-ED. Light scattering signals, and conversion to molar mass distributions as a function of elution volume are shown for each sample. The wild type elution profile is shown as a red line, the W187A mutant is shown in green, and the W187Y mutant is shown in blue.