
Figure 7.
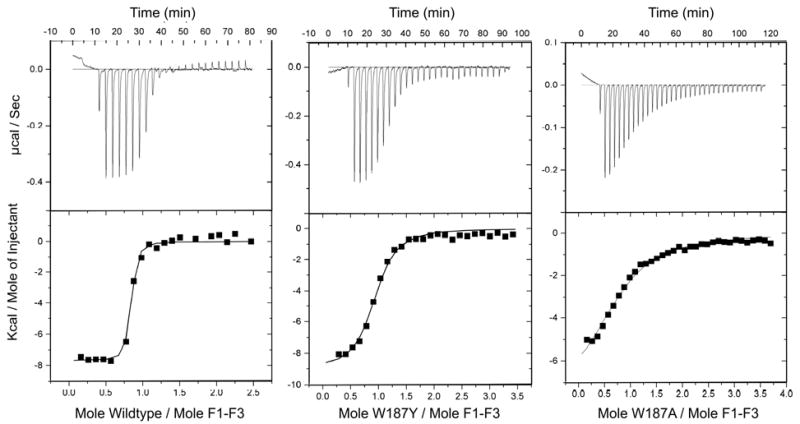
Calorimetry data for titration of NS1-ED (a) wild type, (b) W187A and (c) W187Y into CPSF30 (F1F3). The upper panel shows the heat change observed with titration. The lower panel plots the integration of the peaks using the Origin software package.