
Figure 7.
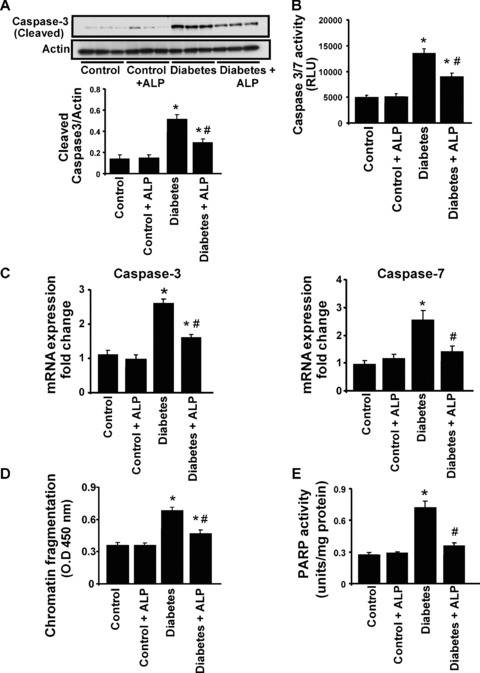
Effects of diabetes and allopurinol (ALP) on myocardial apoptosis and PARP activity. (A) Shown is the representative immunoblot depicting the cleaved caspase 3 expression in the myocardial tissues. The adjacent panel denotes the quantification of cleaved caspase 3 expression in the heart tissues (n= 6; *P < 0.05 versus control; #P < 0.05 versus diabetes. (B) Represents the quantification of caspase 3/7 activity in the myocardial tissues as described in the Methods section (n= 5/group; *P < 0.05 versus control; #P < 0.05 versus diabetes). (C) Shows the mRNA expression of caspase 3/7, respectively, in the myocardial tissues (n= 6; *P < 0.05 versus control; #P < 0.05 versus diabetes). (D) Quantitative determination of apoptosis by determination of chromatin condensation by ELISA (n= 5/group, *P < 0.05 versus control; #P < 0.05 versus diabetes). (E) PARP activity was determined in the myocardial tissues as described in the Methods section (n= 5/group, *P < 0.05 versus control; #P < 0.05 versus diabetes).