Figure 2.
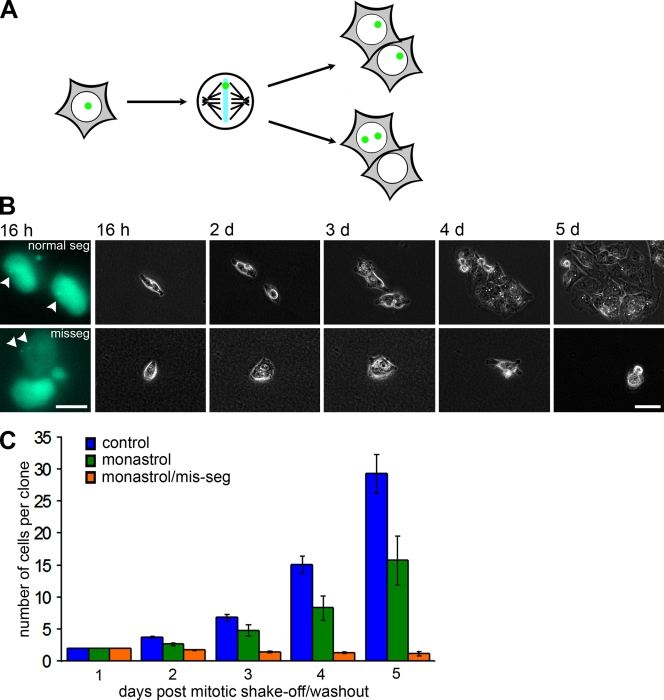
Growth arrest after chromosome missegregation. (A) Schematic for proper segregation and missegregation of a single GFP-marked chromosome. (B) GFP (left) and phase-contrast images of daughter cells that either segregated the marked chromosome normally (top) or abnormally (bottom) at the indicated times after drug washout. Arrowheads point to the LacIGFP/lacO chromosome mark. (C) Number of cells per clone after no treatment, monastrol washout, and monastrol washout with missegregation (mis-seg) of the marked chromosome. Bars represent mean ± SEM (independent clones counted for control, n = 49; monastrol, n = 15; and monastrol/mis-seg, n = 22). Bars: (B, left) 10 µm; (B, right) 50 µm.

