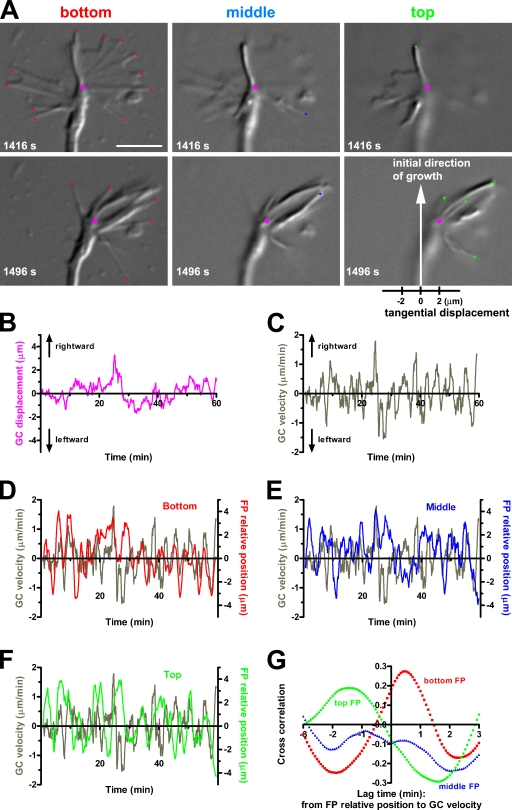
Figure 9.
Temporal correlation between filopodial deviation and growth cone deflection. (A) DIC images of a single growth cone at two time points at three focal planes, each separated by 1 µm in the z direction. All of the filopodial tips in the bottom plane, focused at the level of the coverglass, are marked with red diamonds (left), those in the middle plane with blue diamonds (middle), and those in the top plane with green diamonds (right). The growth cone center is marked with a magenta circle. The horizontal axis shown below the lower right panel was used to determine the tangential components of displacement/velocity of the growth cone center and relative position of the filopodial tips. (B) Tangential displacement of the growth cone (GC) shown in A, with positive and negative values indicating rightward and leftward displacement, respectively. (C) Tangential velocity of the same growth cone. Central difference quotients of the tangential displacement with 80-s intervals are shown. (D–F) Superimposition of the growth cone tangential velocity and the relative position of filopodia (FP) in the indicated focal planes. The filopodia relative position was defined as the tangential component of the distance between the growth cone center and the centroid of filopodia tips. The colored lines represent 80-s central moving averages of the filopodia relative position. (G) The cross-correlation function between the filopodia relative position and the growth cone velocity. Bar, 5 µm.

