
Fig. 1.
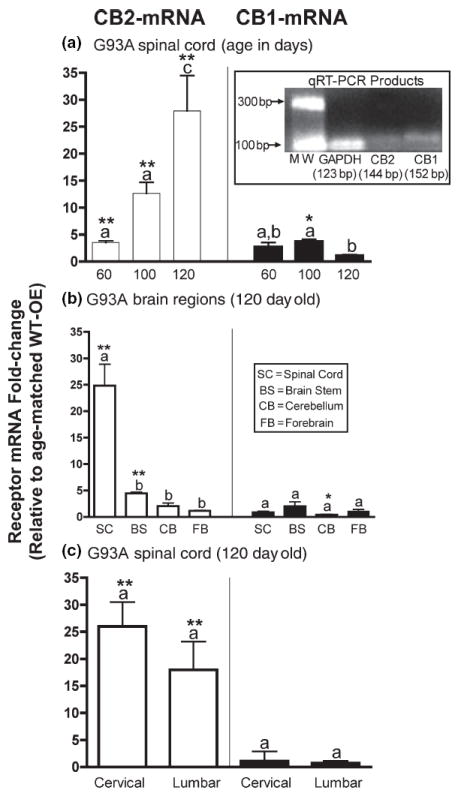
CB2, but not CB1, receptor mRNA is dramatically and selectively up-regulated in the spinal cords of G93A mice in a temporal pattern closely paralleling disease progression. (a) Comparison of CB2 (left panel) and CB1 (right panel) mRNA expression in spinal cords of G93A mice at various ages, relative to age-matched WT-OE control mice. (inset) Separation of PCR products by 1% agarose gel electrophoresis. (b) Comparison of CB2 (left panel) and CB1 (right panel) mRNA expression in various brain regions of 120-day-old G93A mice, relative to age-matched WT-OE control mice. (c) Comparison of CB2 (left panel) and CB1 (right panel) mRNA expression in cervical and lumbar regions of spinal cords of 120-day-old G93A mice, relative to age-matched WT-OE control mice. *, **Significantly different from mRNA expression in WT-OE control mice, p < 0.05, 0.01 (non-paired Student’s t-test). a–cFold-changes that are designated with different letters are significantly different, p < 0.05 (anova followed by a Dunnett’s post hoc comparison).