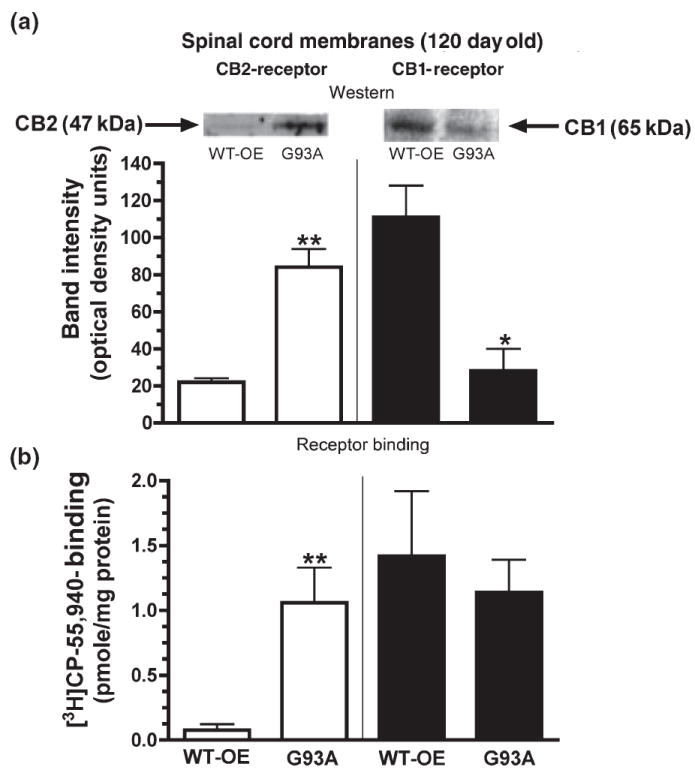
Fig. 2.

Up-regulation of CB2 receptor mRNA in spinal cords of symptomatic G93A mice is reflected by increased CB2 receptor immunoreactivity and binding. (a) Comparison of CB2 (left panel) and CB1 (right panel) protein levels by western analysis in spinal cord membranes of 120-day-old G93A and age-matched WT-OE control mice. The relative protein levels were calculated by normalizing to actin immunoreactivity and subtracting the background intensity (insets). Representative western blot of CB2 (left panel) and CB1 (right panel) receptors. (b) Comparison of specific receptor binding of CB2 (left panel) and CB1 (right panel) receptors in spinal cord membranes of 120-day-old G93A and age-matched WT-OE control mice. Specific CB1 receptor binding was defined as the binding of a receptor-saturating concentration of [3H]CP-55 940 (5 nmol/L) displaced by a receptor-saturating concentration of the CB1 selective ligand AM-251 (200 nmol/L). Specific CB2 binding was defined as the binding of 5 nmol/L [3H]CP-55 940 displaced by a receptor-saturating concentration of the CB2 selective ligand AM-630 (200 nmol/L). *, **Significantly different from the value obtained for WT-OE control mice, p < 0.05, 0.01 (non-paired Student’s t-test).
