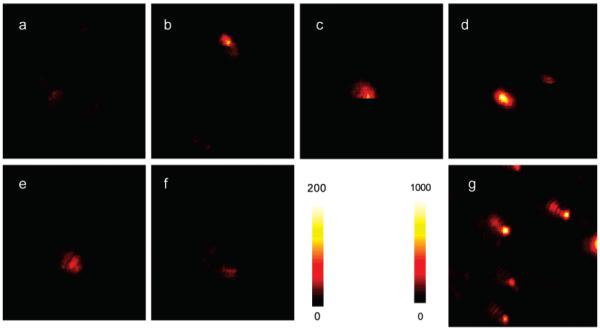
Figure 4.

Respective fluorescence images of single-labeled (a) free Cy5; a single fluorophore on (b) 5, (c) 20, (d) 50, (e) 70, and (f) 100 nm silver particle; and (g) 50 fluorophores on 50 nm silver particle. The intensity bar for a-f is 0-200 and that for g is 0-1000. Sample g was excited at 20% laser intensity of the other samples. The 5 × 5 μm images are 100 × 100 pixels within integration time of 0.6 ms/pixel.
