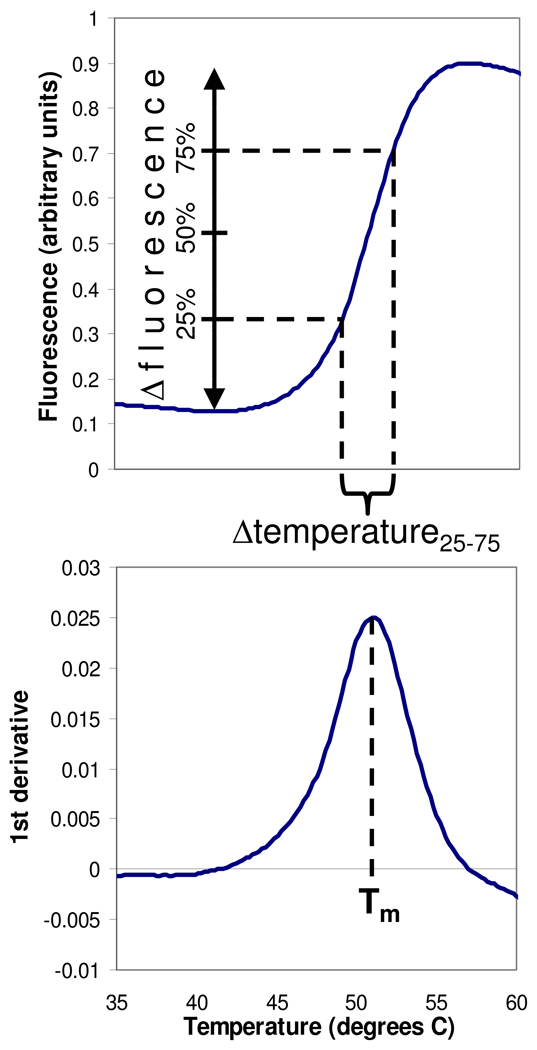
FIG. 1.
Quantitation of protein melting curves. Top panel: raw fluorescence data as a function of temperature. Bottom panel: first derivative of the raw data curve. Melting temperature (Tm) was defined as the temperature where the first derivative is maximal. Δfluorescence was defined as the difference between the minimal fluorescent signal prior to unfolding and the maximal signal. Δtemperature25–75 was defined as the temperature range spanning the middle 50% of the increase in fluorescence.

