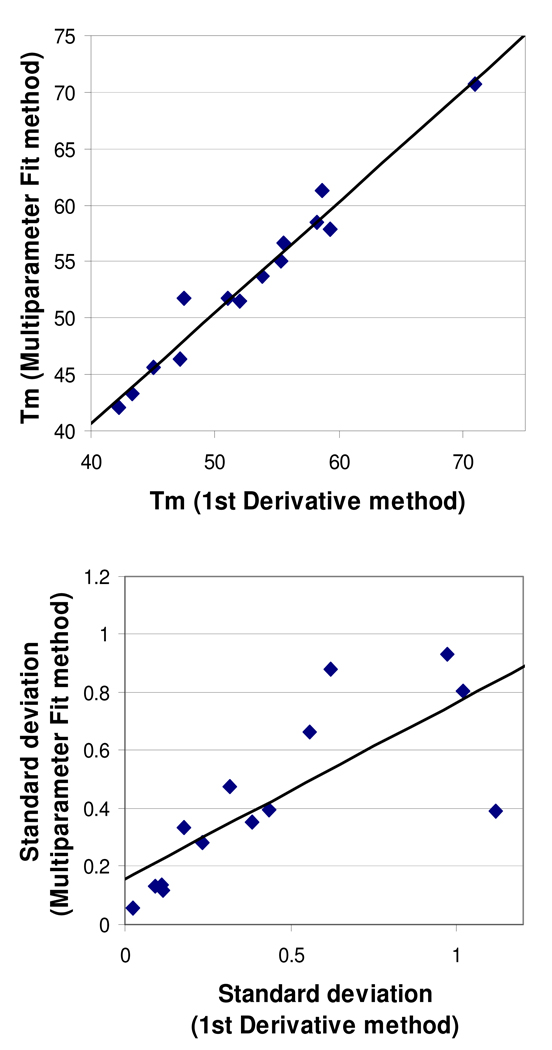
FIG. 2.
Comparison of the First Derivative and Multiparameter Fit methods of determining Tm. Each data point represents one of the 14 most-studied proteins (5–6 plates per protein). Top panel: mean Tm values (in °C) estimated by each method. Equation: y = 0.98x + 1.40; R2 = 0.97. Bottom panel: mean standard deviations in Tm (in °C) estimated by each method. Equation: y = 0.61x + 0.16; R2 = 0.60.

