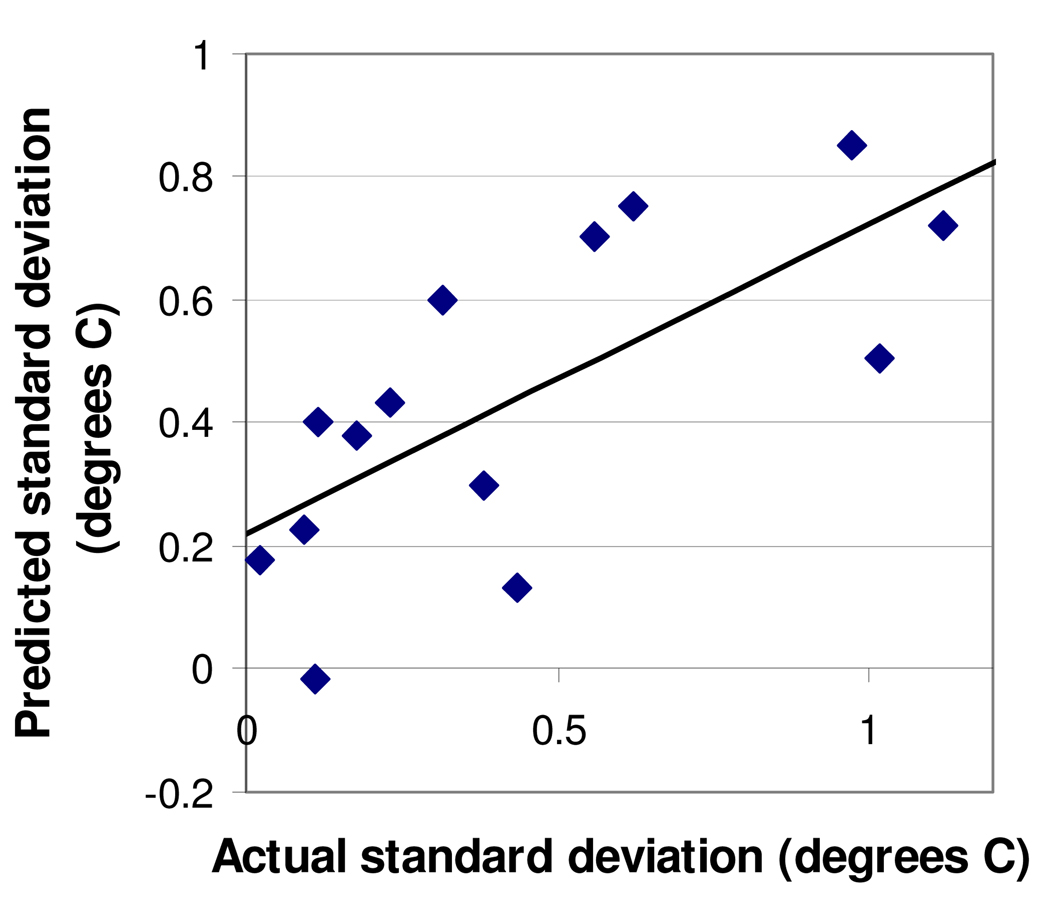
FIG. 3.
Prediction of proteins' standard deviations in Tm based upon Δfluorescence and Δtemperature. Predicted standard deviation (the Y axis) was calculated as 0.046(Δtemperature) minus 0.40(Δfluorescence) plus 0.60, a "best-fit" equation that minimized the difference between predicted and actual standard deviations. The R2 value for the predicted-vs.-actual graph is 0.50. Each data point represents one of the 14 most-studied proteins (5–6 plates per protein).

