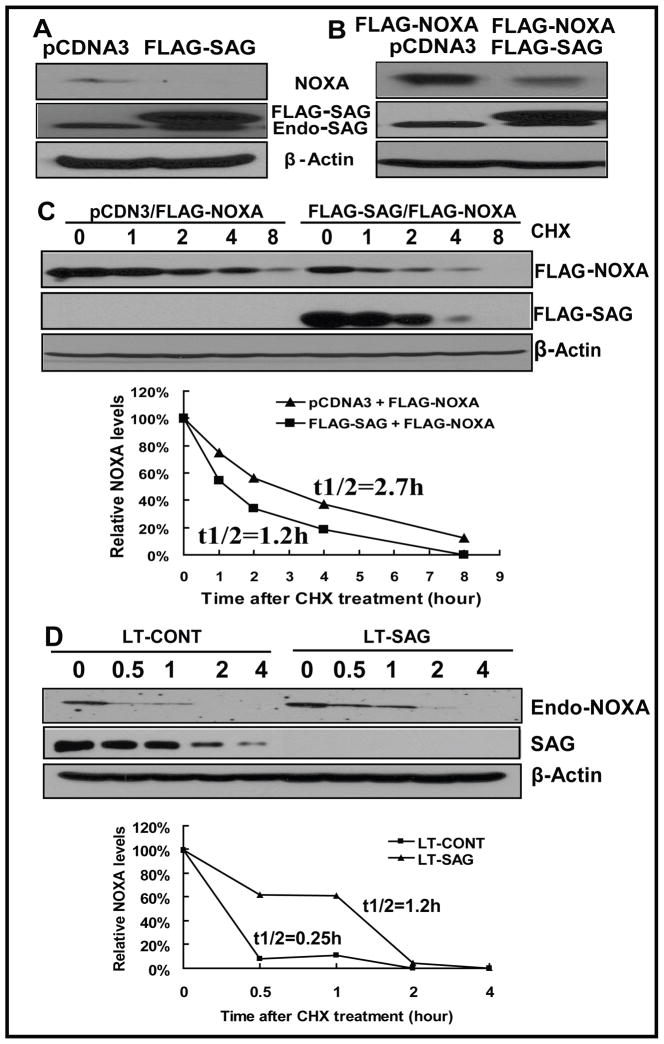
Figure 5. SAG manipulation changes Noxa level and protein half-life.
(A) SAG overexpression eliminates endogenous Noxa. U87 cells were transiently transfected with pcDNA3-FLAG-SAG, along with pcDNA3 as a control. Cells were harvested 30 hr later and subjected to Western blotting using anti-Noxa antibody with β-Actin as the loading control. (B) SAG overexpression reduced the level of ectopically overexpressed Noxa. U87 cells were transiently cotransfected with FLAG -Noxa and FLAG-SAG or FLAG -Noxa and pcDNA3. Cells were harvested 30 hr later and subjected to Western blotting using anti-FLAG antibody (For FLAG-Noxa) and anti-SAG (for FLAG-SAG and endogenous SAG) with β-Actin as the loading control. (C) SAG overexpression shortened the protein half life of Noxa. U87 cells were transiently cotransfected with FLAG -Noxa and FLAG-SAG or FLAG -Noxa and pcDNA3. Twenty-four hrs later, cells were treated with CHX at 20 μg/ml for indicated periods of time, followed by Western blotting using antibodies against FLAG (for FLAG-Noxa), SAG (for FLAG-SAG) with β-Actin as the loading control. The relative Noxa levels were quantified by densitometry analysis using ImageJ1.410 image processing software. (D) SAG knockdown extended the half life of endogenous Noxa. U87 cells were infected with LT-SAG, along with LT-CONT for 96 hrs and then split. Twenty-four hrs later, cells were treated with CHX at 20 μg/ml for indicated periods of time, followed by Western blotting using antibody against endogenous Noxa with β-Actin as the loading control. The relative Noxa levels were quantified by densitometry analysis using ImageJ1.410 image processing software. Endo-Noxa: endogenous Noxa.

