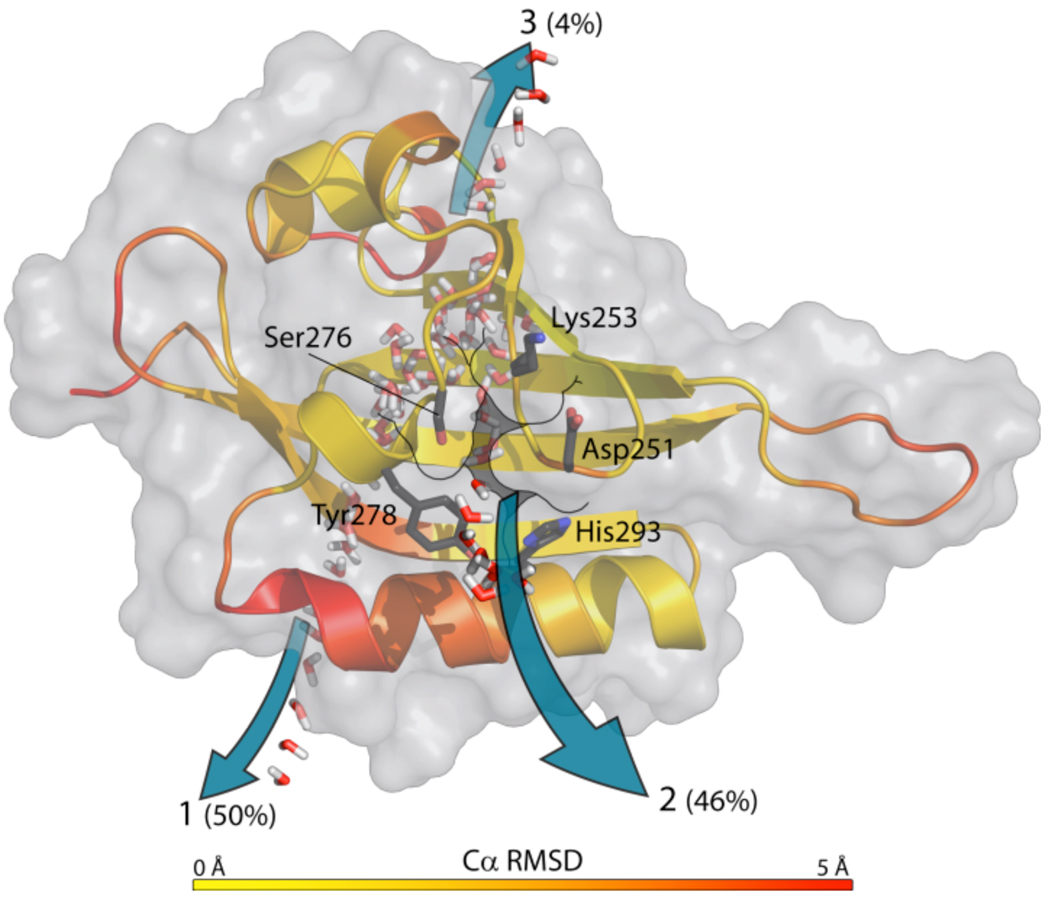
Figure 5. Molecular dynamics suggest routes of ligand entry and egress.
Heat map of HIF2α PAS-B derived from Cα-RMSD values over the course of 35 ns molecular dynamics simulations. Water passage pathways are superimposed on the crystal structure and noted with pathway numbers and percentages of total observed water entry/exit events.

