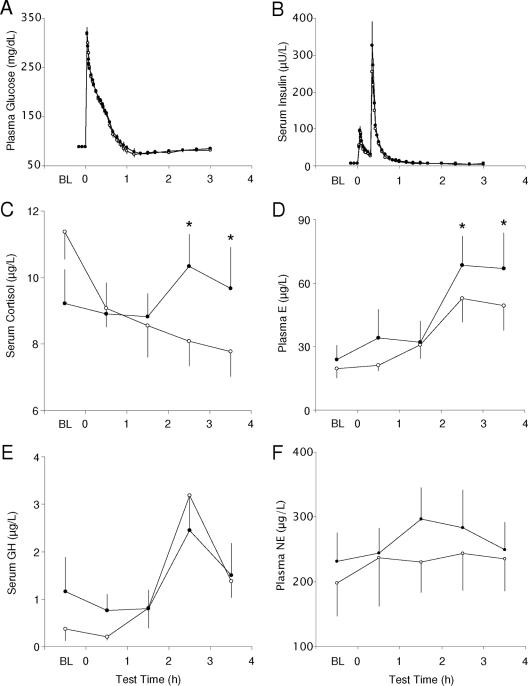
Figure 3.
Mean (+se) profiles of circulating counter-regulatory hormones measured before (baseline, BL) and every 30 min after an iv glucose challenge at the end of the 8.5-h (open circles) and 5.5-h (solid circles) bedtime conditions. Significant differences between the two bedtime conditions are identified with an asterisk. A, Plasma glucose concentrations during the IVGTT (n = 11); B, serum insulin concentrations during the IVGTT (n = 11); C, hourly serum cortisol concentrations (n = 11); D, hourly plasma epinephrine (E) concentrations (n = 7); E, hourly serum GH concentrations (n = 11); F, hourly plasma norepinephrine (NE) concentrations (n = 7). *, P < 0.05 in post hoc comparisons between the two bedtime conditions based on repeated measures ANOVA.

