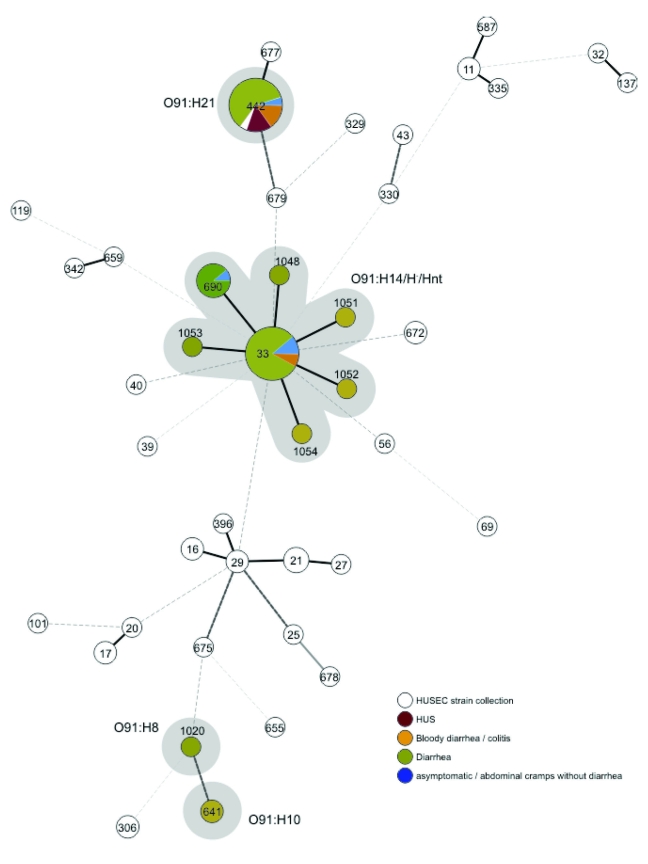
Figure.
Minimum spanning tree based on the multilocus sequence typing allelic profiles portraying the clonal distribution of the 100 Escherichia coli O91:H8/H10/H14/H21/H–/Hnt isolates (highlighted in gray) associated with different diseases in relation to the hemolytic uremic syndrome–associated enterohemorrhagic E. coli collection. Each dot represents a given sequence type, and the size of each circle is proportional to the number of strains analyzed. Connecting lines show the number of identical alleles between 2 STs (thick black line, 6 of 7 alleles identical; thick gray line, 5 alleles identical; thick dashed line, 4 alleles identical; thin dashed lines of increasing length, <3 alleles identical).

