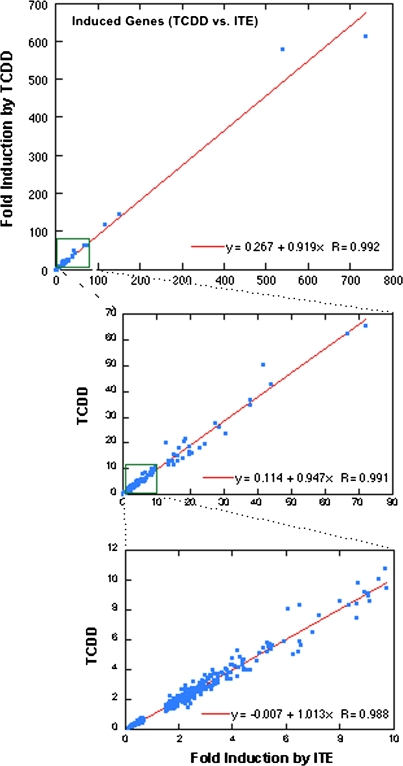
FIG. 2.
Gene induction by ITE and TCDD is highly correlated. Calculated mean fold induction/decrease by TCDD compared with DMSO is plotted against mean fold induction/decrease by ITE for all genes that were significantly changed (> 1.5-fold or < 0.67-fold, q value < 5%). Linear regression and correlation coefficients are shown for each range of the plot.

