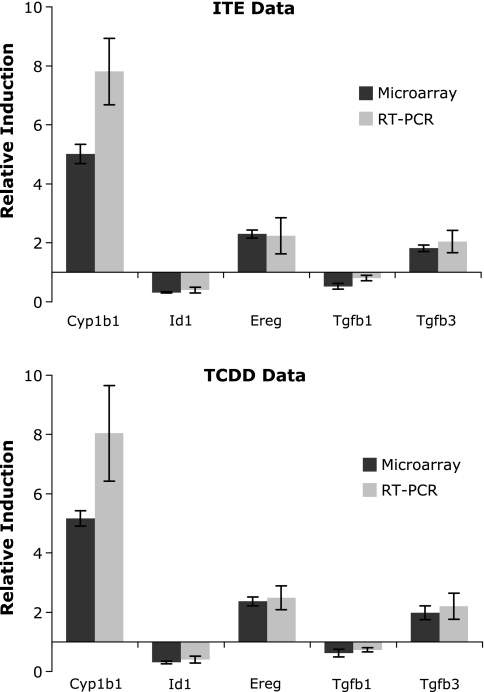
FIG. 3.
RT-qPCR confirms gene expression data from microarrays. Fold induction by ITE and TCDD relative to DMSO as calculated from microarrays and RT-qPCR using the same RNA samples is shown for selected genes. Cyp1a1 also showed equivalent induction by RT-qPCR and microarray, but actual values are off this scale and are not shown. All values are normalized to expression of Gapdh in the same samples; mean ± SD (n = 5).

