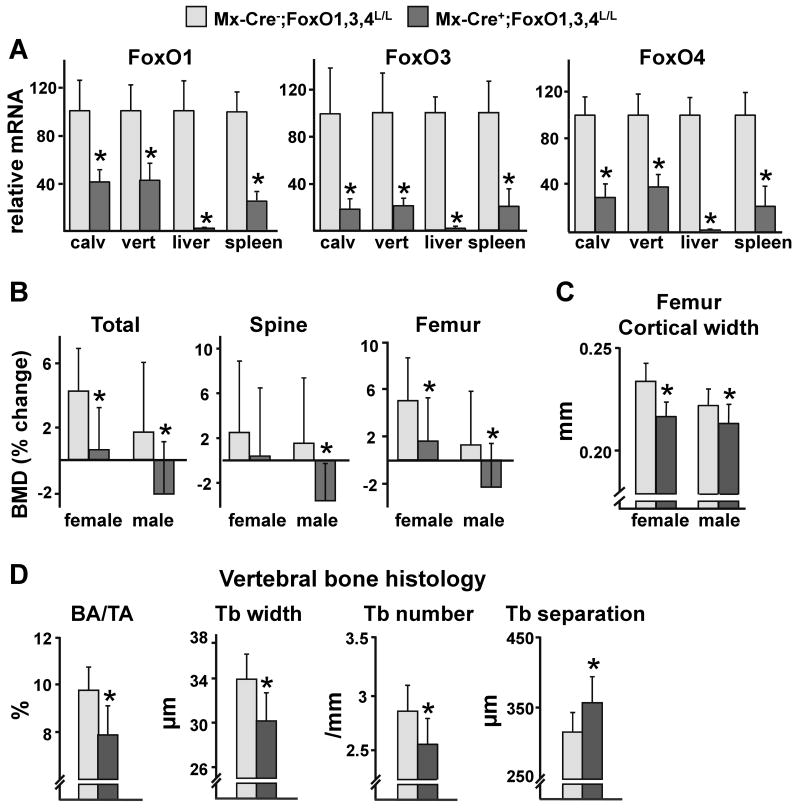
Figure 1. Bone Mass is Decreased Following FoxOs Deletion.
(A-D) 12 wk-old female and male mice were injected with pI-pC and sacrificed 5 wk later.
(A) mRNA levels of FoxOs in calvaria (calv), vertebra (vert), liver or spleen from male mice determined by qRT-PCR (n=8 mice/group).
(B) BMDs determined by DEXA 1 d before and 5 wk following pI-pC injections (n=10-17 mice/group). *p<0.05 vs respective Mx-Cre- by Student's t-test
(C) Cortical width measured by micro-CT in femurs (n=10-17 mice/group). *p<0.05 vs respective Mx-Cre- by Student's t-test
(D) Histomorphometric analysis of longitudinal undecalcified sections of L1-L3 vertebrae of male mice (n=6-7 mice/group). BA/TA=bone area per tissue area; Tb=trabecular.
*p<0.05 by Student's t-test.

