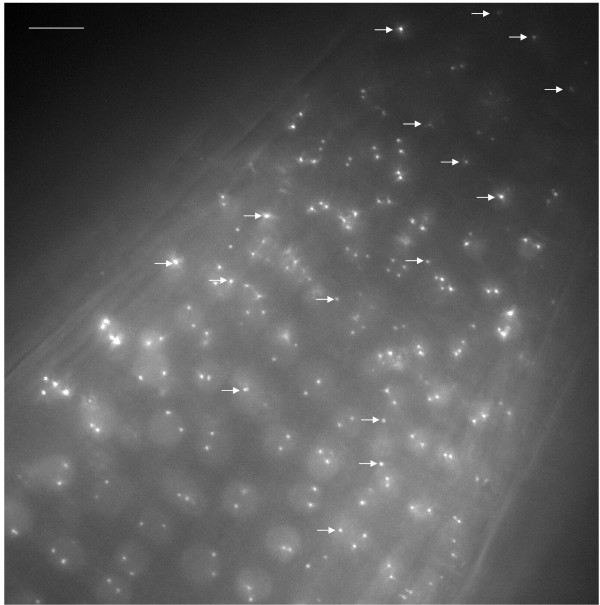
Figure 3.
Fluorescent dots in nuclei of cells in root division zone. High magnification image of the division zone from a root of a seedling homozygous for the 112 tagged locus (Fig. 1B). The gene encoding the EGFP-LacI fusion protein is under the control of the RPS5 promoter, which is active in this region of roots. In the majority of nuclei, two separate dotes are visible. In about 15%, however, only a single dot is resolved (arrows). For each nucleus, the 3D inter-allelic distance in micrometers was determined using Imaris software for point detection and point-to-point distance measurements (Methods section). Values are shown graphically in Figure 5. The bar indicates 10 μm. The image shows a maximum projection in which all 41 optical sections are collapsed into one plane.

