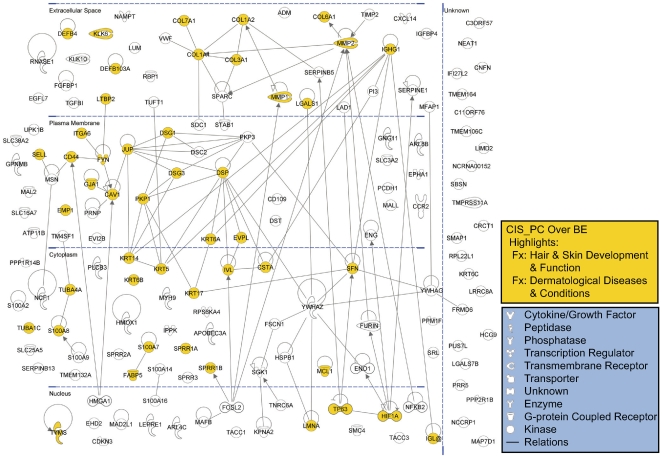
Figure 4. IPA pathway graphical representation for the CIS_PC over BE dataset of up-regulated genes.
155 genes (IPA mapped IDs) are represented out of 190 SAGE tags up-regulated in both CIS and PC relative to BE. (See Table S2 for tag data.) Gene products are positioned according to subcellular localization. Only direct connections (i.e., direct physical contact between two molecules) among the individual gene products are shown for clarity of presentation; lines indicate protein-protein binding interactions, and arrows refer to “acts on” interactions such as proteolysis, expression, and protein-DNA/RNA interactions. Genes associated with epidermal development (see Table 3) are highlighted.

