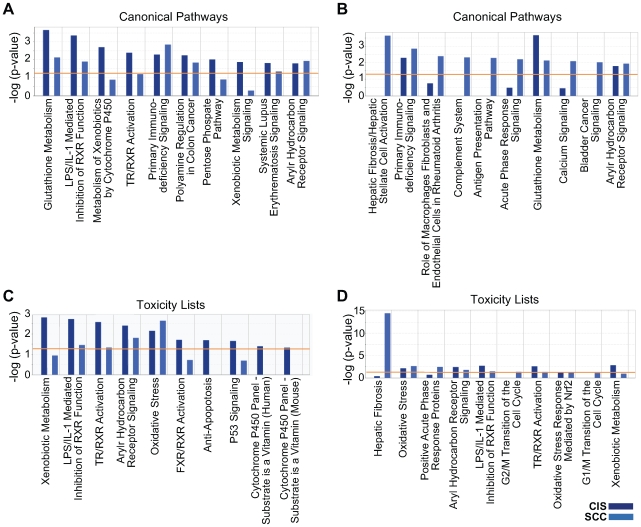
Figure 6. IPA canonical pathways analysis and toxicity lists analysis of the CIS over BE_PC and the SCC over BE_PC datasets.
For analysis of the CIS over BE_PC dataset, 109 IPA mapped IDs were eligible; for analysis of the SCC over BE_PC dataset, 153 IPA mapped IDs were eligible. The two sets of data were displayed together using IPA core comparisons, and the 10 most significant functions within Canonical Pathways and Toxicity Lists are shown above for each dataset. The data in A and C is sorted according to highest significance in CIS over BE_PC, and the data in B and D is sorted according to highest significance in SCC over BE_PC. The orange line indicates the threshold limit of significance, preset at a p-value of 0.05.

