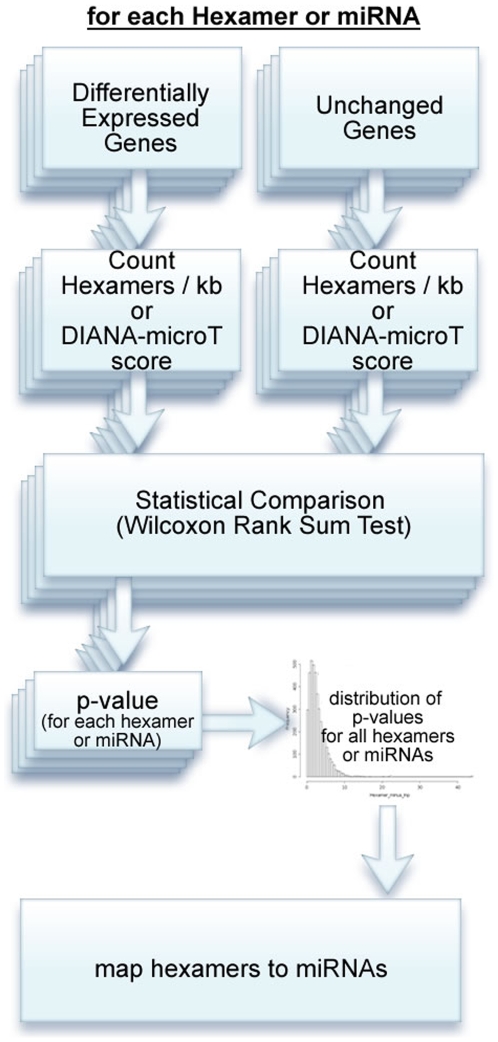
Figure 2. Overview of the algorithm.
For each possible hexamer, the occurrences on the 3′UTRs of changed and unchanged genes are counted. The counts are compared using the Wilcoxon Rank Sum Test and a p-value produced. The distribution of p-values is plotted in a histogram. Hexamers are mapped back to known miRNA sequences (see Figure 1). When DIANA-microT target prediction scores are used, the Wilcoxon Rank Sum Test is performed between scores of changed and unchanged genes. A p-value is calculated for each miRNA and a corresponding histogram is produced. The histogram and sorted p-values are returned to the user in the Results page (see Figure 4).

