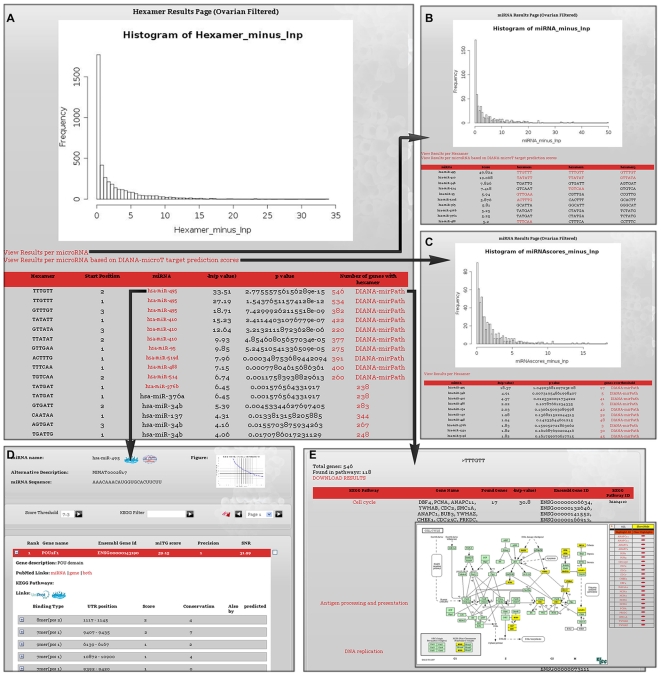
Figure 4. Results Page and links (Epithelial Ovarian Cancer).
Genes upregulated and miRNAs downregulated in late stage Epithelial Ovarian Cancer (EOC) compared to early stage EOC were run through DIANA-mirExTra. The main results page (A) consists of two parts. At the top of the page is the histogram of the distribution of –lnp values for all possible hexamers and at the bottom, the sorted list of hexamers that can be mapped on deregulated miRNAs with corresponding p-values. The same hexamer can be shown multiple times if it can be mapped on more than one miRNAs. Hexamers are sorted according to p-value and negative natural logarithm (-lnp value). Following the link “View Results per microRNA” the user is taken to a page (B) showing miRNAs sorted according to a combinatorial score produced by the values of hexamers 1 and 2. The link “View Results per microRNA based on DIANA-microT target prediction scores” leads to a similar results page (C) that uses as a measure the scores of each gene according to miRNA target prediction program DIANA-microT. (D) Genes that contain at least one of the top ten hexamers are marked in the results page of DIANA-microT. The DIANA-microT results page for each miRNA can be found following the link on the miRNA name from the first results page. Additionally, links to DIANA-mirPath lead to a page (E) showing functional analysis results using this program. Genes containing the hexamer of interest (A), or targeted by the miRNA of interest (C) are mapped on KEGG pathways and the most significantly overrepresented pathways can be identified by their corresponding p-values.

