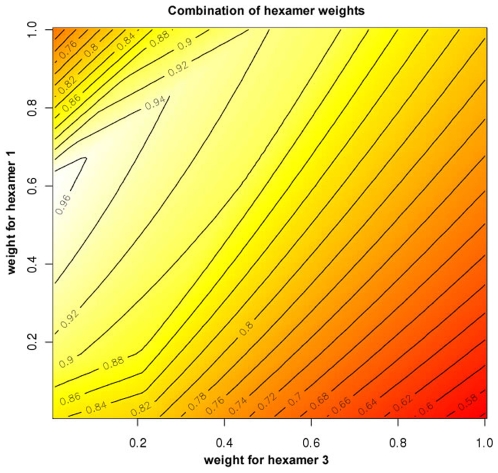
Figure 5. Combination of weighted -lnp values of the three hexamers.
The weight for hexamer 1 is on the Y axis, for hexamer 2 is held constant at a value of 1, and for hexamer 3 is on the X axis. The mean normalized difference of the correct miRNA versus the next highest miRNA was maximized for 5 datasets of knocked out miRNAs (see Methods). The optimal weights combination for hexamers 1 and 3 were identified as 0.6 and 0 respectively. The value for hexamer 3 is still given in the Results page (see Figure 4) although it is not used for the combined score calculation.

