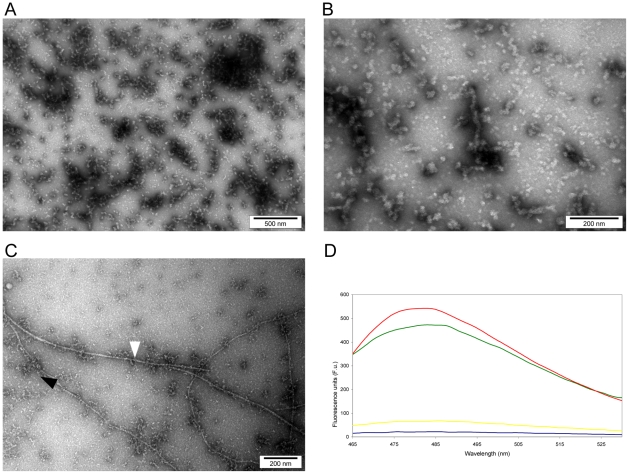
Figure 3. Characterisation of MstnPP soluble aggregates by negative-stain transmission electron microscopy (TEM) and ThT binding.
(A–B) TEM of MstnPP soluble aggregates and C. insulin positive control containing both protofibrils (black arrow) and mature fibrils (white arrow). D. ThT binding of MstnPP soluble aggregates (green), compared to an insulin positive control (red), the MstnPP dimer (yellow) and a buffer (50 mM Tris-HCl pH 8.5, 150 mM NaCl) blank (blue).

