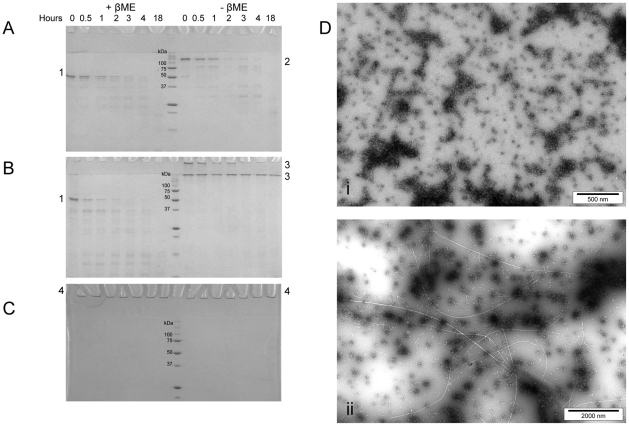
Figure 6. SDS-PAGE and TEM analysis showing MstnPP resistance to trypsin digestion.
A. dimer; and B. soluble aggregates. Major bands are indicated: 1. MstnPP monomer; 2. MstnPP dimer; 3. MstnPP soluble aggregates. C. MstnPP fibrils: 4. prefibrillar aggregates plus fibrils. Samples were analysed in sample buffer +/− βME where βME concentration is 2 M. D. TEM shows resistance of (i) protofibrils and (ii) amyloid fibrils to trypsin. Trypsin digests were performed with a MstnPP∶trypsin ratio of 100∶1 (A and B) or 20∶1 (C and D) for 18 hours at 37°C.

