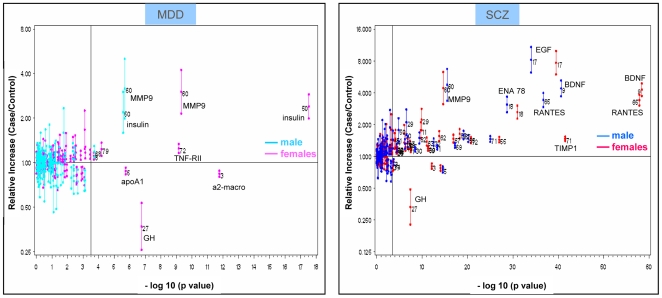
Figure 1. Relative change of protein markers in MDD or schizophrenia against their p-values.
Plot of relative changes for measured analytes in depression (a) and schizophrenia (b) against their p-values. The Y axis reports the relative increase (or decrease) as the ratio (and the confidence interval) based on analysis of log-transformed data from cases/controls. Reference vertical line corresponds to p-value threshold at a 5% significance level, after correction for multiple testing. Male and females are computed and reported separately.

