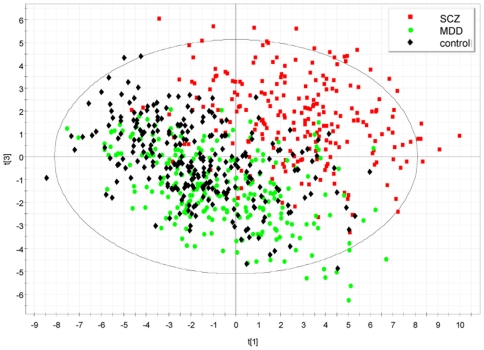
Figure 3. PCA plot showing the separation of schizophrenia samples from controls and MDD.
PCA plot obtained by using SIMCA, where the 1st and 3rd components of the model (t[1] and t[3], respectively) are shown. The graph is obtained by replacing values below detection limit with the lowest value measured for each protein (conservative approach).

