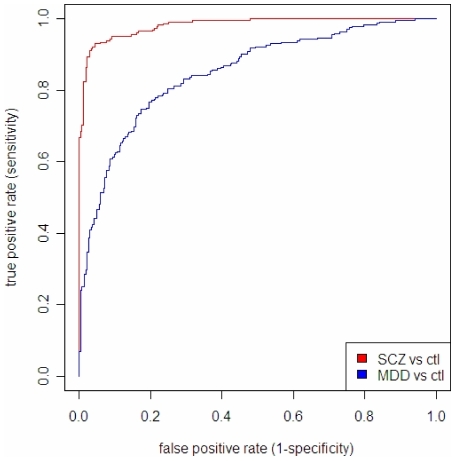
Figure 6. Receiver-operating characteristic (ROC) plot derived from linear discriminative analysis (LDA) based on the top findings from the PLS approach.
ROC plot of sensitivity (True Positive Rate, Y-axis) versus 1 – specificity (False Positive Rate, X-axis) based on a Linear discrimination model (LDA) built upon the 10 markers with the highest contribution as determined by PLS-DA.

