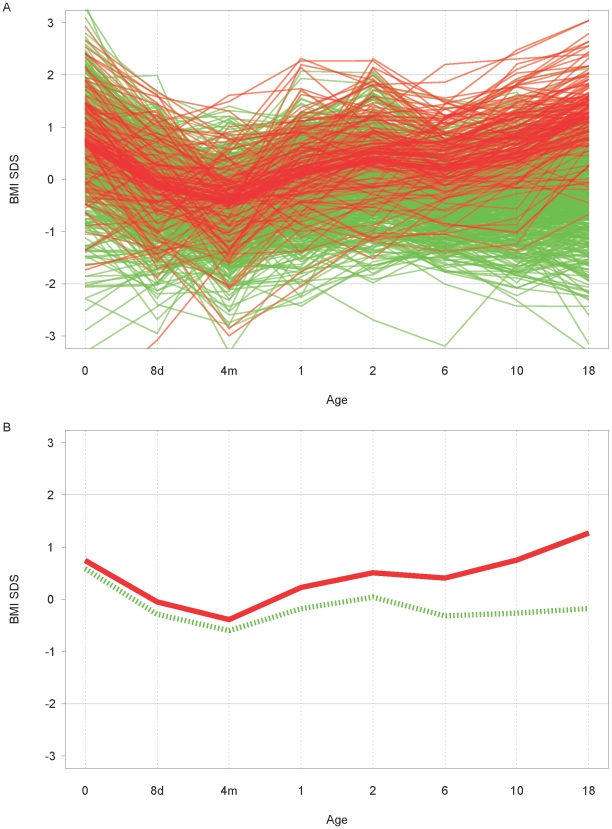
Figure 2. Broken sticks trajectories of BMI SDS changes.
A. Broken sticks trajectories for subjects with normal weight (green lines) versus subjects with overweight (red lines) at young adulthood, B. Broken-stick model of mean increments for subjects with normal weight and with overweight at young adulthood. The green, dotted line represents the mean increments of subjects with normal weight, the red line the mean increments of subjects with overweight at young adulthood.

